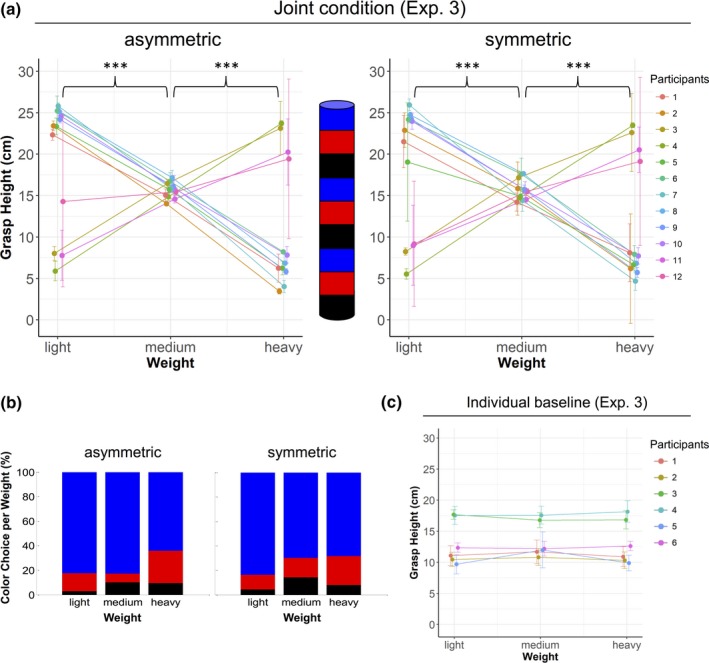
Figure 6.

Mean grasp height (a) in the joint condition and (c) in the individual baseline of Experiment 3 is shown as a function of object weight and participant. In the joint condition, all participants grasped the objects at different heights as a function of their weight. Grasp height was not modulated in the individual baseline. The object centrally depicted in (a) illustrates where the colored stripes were located relative to participants’ grasp positions. Error bars show standard deviations. Panel (b) shows the mean color choice (in % of trials) per weight and condition across participants. ***p < .001.
