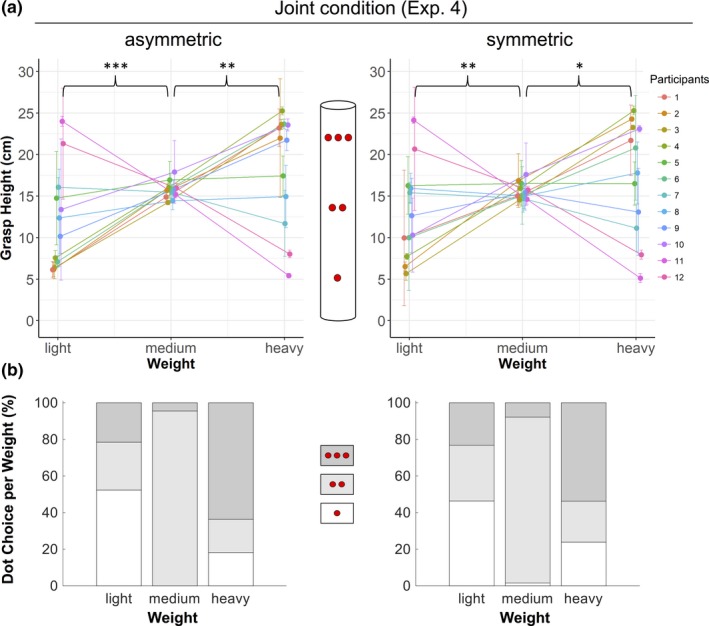
Figure 7.

Mean grasp height in Experiment 4 is shown as a function of object weight and participant. Seven of 12 participants chose grasp positions indicating a numerosity‐weight mapping: They grasped light objects at the bottom where one dot was attached, medium objects around the middle (two dots), and heavy objects at the top (three dots). The object centrally depicted in (a) illustrates where the numerosity cues were located relative to participants’ grasp positions. Error bars show standard deviations. Panel (b) shows the mean choice of dots (in % of trials) per weight and condition across participants. Dark gray represents three dots, medium gray represents two dots, and white represents one dot. *p < .05, **p < .01, ***p < .001.
