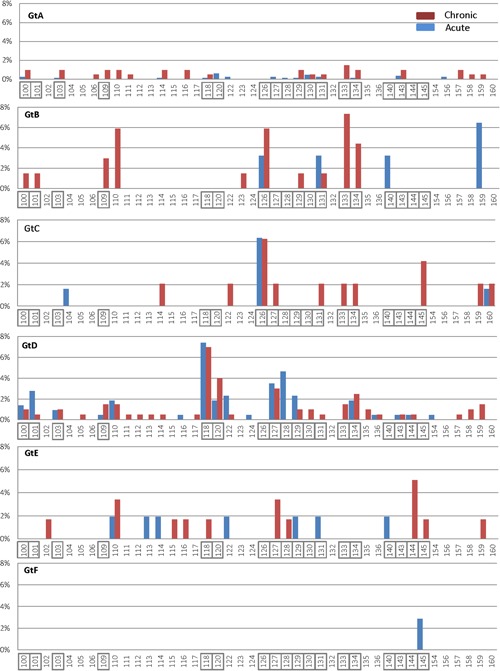
Figure 3.

Frequency and distribution of amino acid substitutions within the HBsAg (amino acid residues 1 to 203) of genotypes A to F. Acute strains are shown in blue bars and chronic strains are in red bars. Positions associated with vaccine/immune escape and/or test result are boxed. Gt, genotype; HBsAg, hepatitis B surface antigen
