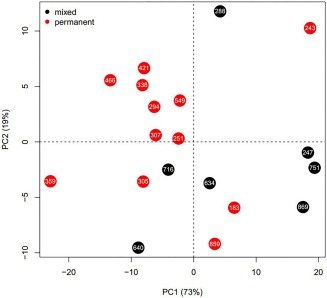
Figure 4.

Principal component analysis (PCA) based on alveolar inclinations. Individuals are color‐coded according to their dentition (mixed = red; permanent = black). Horizontal axis represents PC1 (describing 73% of the total variance) while vertical axis represents PC2 (capturing 19% of the total variance)
