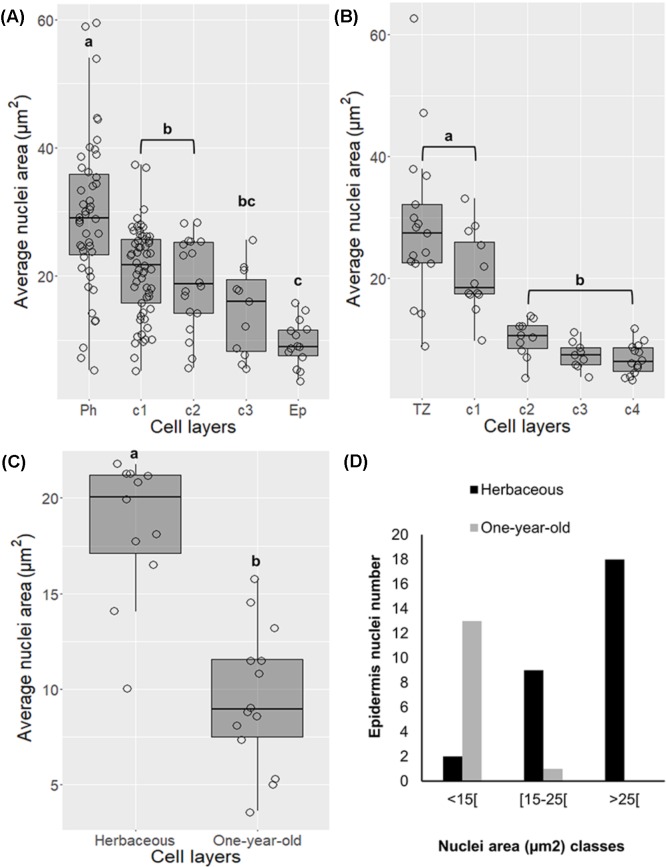
FIGURE 2.
Changes in nuclei area in differentiating cork cells in young periderms from one and three-year-old sprigs (A), in traumatic periderms (B), and in epidermis from herbaceous (entire epidermis) to one-year-old sprigs (disrupted epidermis) (C). (D) Epidermis from one-year-old sprigs shows no nuclei with areas higher than 25 μm2. Boxplots represent minimum nuclei area, first quartile (bottom of box), median, third quartile (top of box), and maximum. The distribution of every individual measurement is represented by jittered dots.

