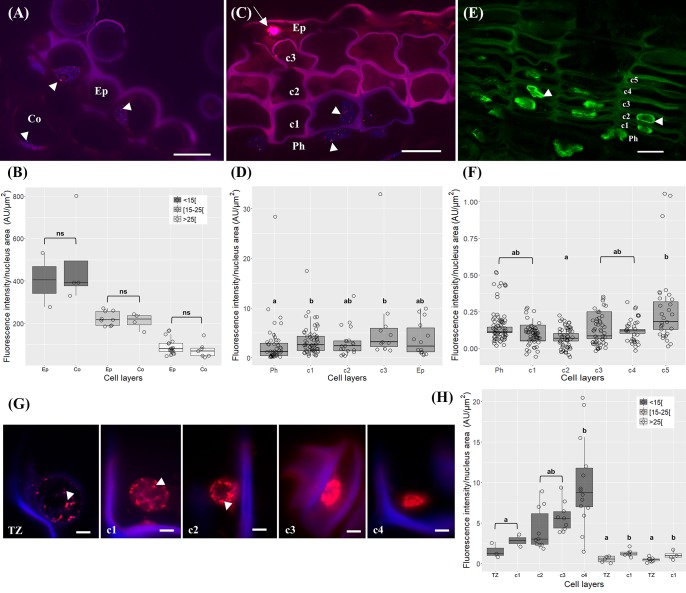
FIGURE 4.
Immunolocalization of 5-methylcytosine (5-mC) in periderms from young sprigs and traumatic periderms. (A) Herbaceous sprigs nuclei show discrete 5-mC signals distributed in small spots all over the chromatin in cortex and epidermis, with similar intensity level in all the nuclei area classes [<15[, [15;25[, and [<25[ μm2 (B). (C) Nuclei of one-year old sprigs show 5-mC signals dispersed throughout the nucleus in all cork cell layers c1, c2, c3, c4; an epidermal nucleus shows high levels of DNA methylation (arrow); (D) all cork cells show significant higher intensity levels of 5-mC when compared with phellogen, except for c2 and a 2.5-fold increase is detected from the phellogen to the older cork cell layer (c3). (E) Nuclei of three-year-old sprigs show highest intensity of 5-mC signals at the nuclear periphery with a significant increase from c2 to c5 (F). (G) Nuclei from traumatic periderms show increase and change in distribution: the nuclei from the tear zone and the most recently formed cork cell layer (c1) display slight dispersed 5-mC signals, that become stronger at the nuclear periphery in older cork cell layers (c2, c3, and c4). (H) A significant and pronounced increase in the 5-mC levels is noticed from the tear zone to the older cork living cell layer (c4) in nuclei with areas less than 15 μm2. Boxplots represent minimum fluorescence intensity/nucleus area, first quartile (bottom of box), median, third quartile (top of box), and maximum. The distribution of every individual measurement is represented by jittered dots. Arrowheads indicate 5-mC signals. Similar small letters indicate no significant differences. DNA was counterstained with DAPI. Bars in (A,C,E) = 10 μm and in (G) = 2 μm. Ph, phellogen; Ep, epidermis; Co, cortex; Tz, tear zone.

