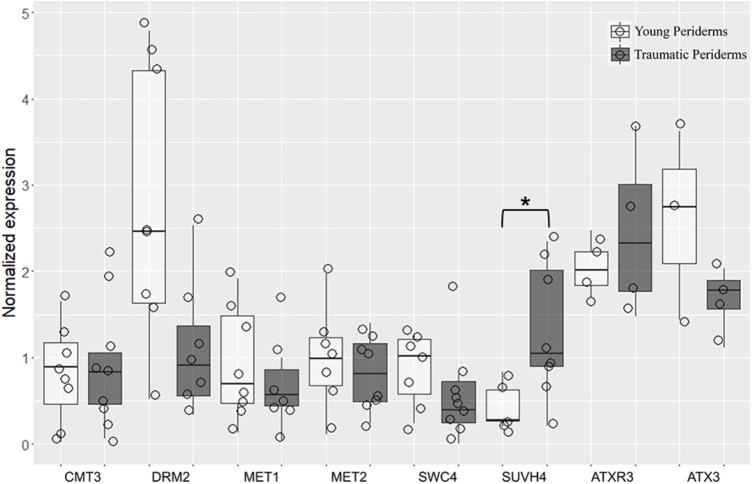
FIGURE 9.
Quantitative real-time PCR (qRT-PCR) evaluation of QsCMT3, QsDRM2, QsMET1, QsMET2, QsSWC4, QsSUVH4, QsATXR3, and QsATX3 mRNA transcripts at different stages of periderm development: young (one and three-year-old sprigs) and traumatic periderms. Results are expressed as means ± standard deviation of at least six individuals and three technical replicates. Transcript levels were normalized to actin and GAPDH. Asterisks indicate the significance of the difference between young and traumatic periderms. Boxplots represent minimum relative expression, first quartile (bottom of box), median, third quartile (top of box), and maximum. The relative expressive of every individual is represented by jittered dots.

