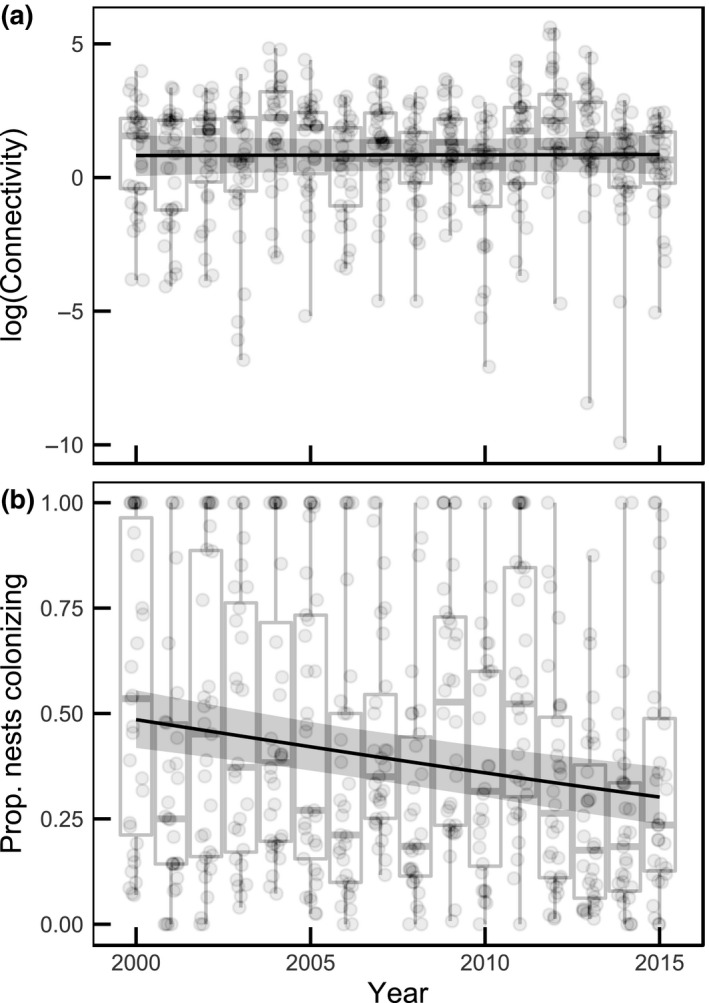
Figure 2.

Temporal trends in (a) the connectivity between local populations and (b) the proportion of overwintering Melitaea cinxia nests within each SIN representing colonization of new patches. The boxplots illustrate the variability between SINs in different years and the trend line illustrates the temporal trend derived from a binomial GLM (+‐95% Cr.I.)
