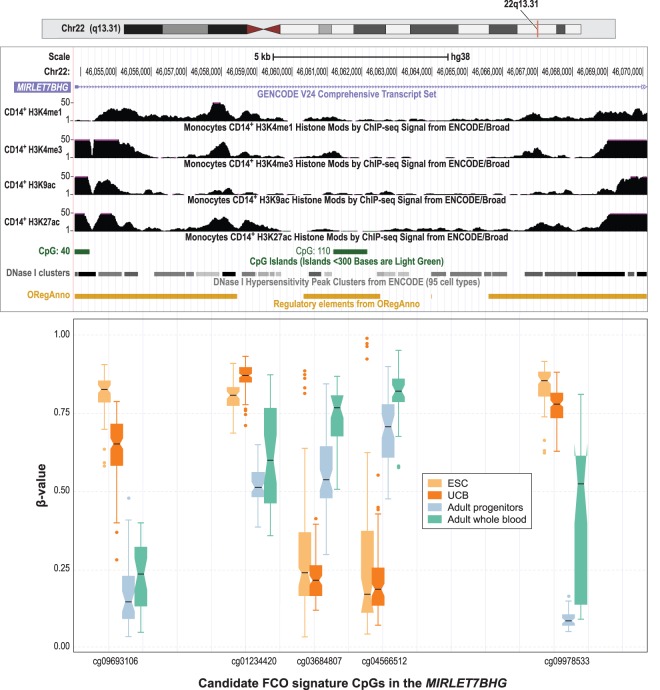
Figure 4.
Candidate CpGs in the FCO methylation signature in the MIRLET7BHG locus on Chromosome 22. Box plots compare the DNA methylation levels (as β-values) at each CpG site for ESC (in yellow), UCB (in orange), adult progenitors (in green), and adult whole blood (in magenta). In the boxplots: (1) The box shows the interquartile range (IQR), (2) the whiskers show the inner fences (1.5 × IQR out of the box), (3) the bolded line shows the median of the data, and the notches-horns display the 95% confidence interval of the median. We rearranged the scale of the boxplots to approximate the different genomic context measured by the probes. Above the boxplots, tracks from the UCSC Genome Browser show the epigenomic features of normal adult CD14+ monocytes including activating histone marks, DNase I hypersensitivity clusters, and transcription factor binding sites. (ORegAnno) Open Regulatory Annotation Database (Lesurf et al. 2016). Differences in DNA methylation between fetal cells (ESC and UCB) and adult cells (adult progenitors and adult whole blood) were statistically significant at P < 2.0 × 10⁻¹⁶ after Bonferroni correction for all five CpG sites. Differences in DNA methylation between ESC and adult progenitors were significant for four out of five CpGs (P < 5.9 × 10⁻⁴) after Bonferroni correction (cg03684807 was not significant; P = 0.26).

