Figure 6.
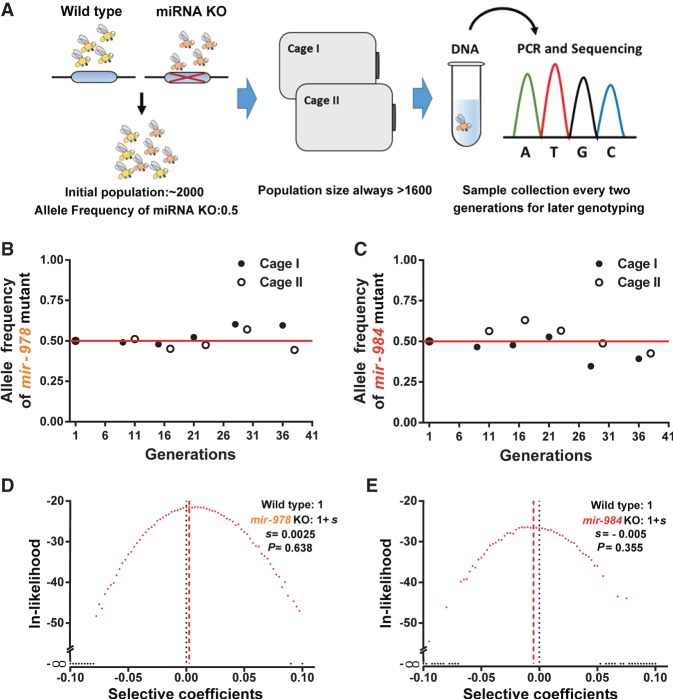
Assay for total fitness of miRNA deletions in laboratory populations. (A) Setup of laboratory populations. Throughout the experiment, the population size never dropped below 1600. A sample of about 200 flies is collected from each cage every two generations. Genotype identification by single-fly PCR and sequencing is done on samples of various time points. (B,C) Allele frequency changes of miRNA KO mutants in laboratory populations over about 40 generations. Allele frequencies do not appear to deviate from the initial frequency of 0.5 (for details, see D,E). (D,E) Likelihood distributions of the selective coefficient of miRNA KO mutants. The fitness of miRNA KO alleles is 1 + s, whereby s is expected to be negative. The maximal likelihood estimate of s is 0.0025 and −0.0005, respectively, for mir-978 and mir-984. Neither is significantly different from 0 (P = 0.638 and 0.355 by the χ2 test).

