-
A–F
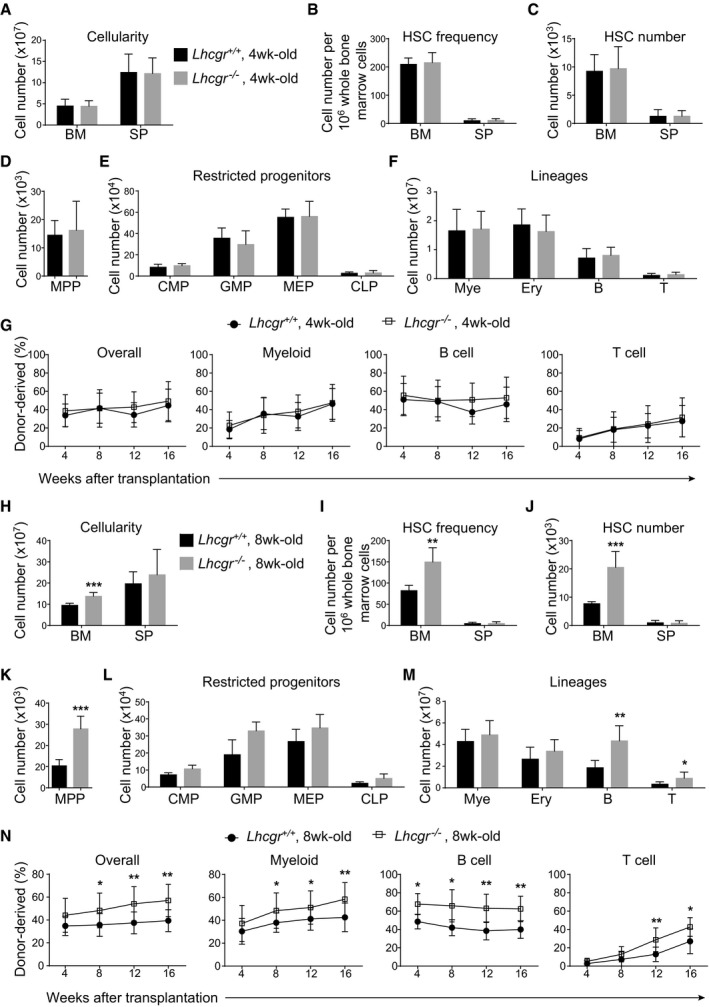
Bone marrow cellularity (A), HSC frequency (B) and numbers of HSCs (C), MPPs (D), restricted progenitors (E), and hematopoietic lineages (F) in the bone marrow (two tibias + two femurs) from paired 4‐week‐old Lhcgr
−/− and control mice. All data reflect mean ± SD (n = 6 mice/genotype from three independent experiments). Two‐tailed Student's t‐tests were used to assess the statistical significance between Lhcgr
−/− and control mice.
-
G
Competitive reconstitution assay in which 300,000 of donor‐derived bone marrow cells from 4‐week‐old Lhcgr
−/− or control mice were transplanted along with 300,000 recipient‐type competitor cells into irradiated recipient mice (n = 12 recipient mice/genotype from three independent experiments). Data represented mean ± SD. The statistical significance of differences between Lhcgr
−/− and control mice was assessed using two‐way ANOVAs.
-
H–M
Bone marrow cellularity (H), HSC frequency (I) and numbers of HSCs (J), MPPs (K), restricted progenitors (L), and hematopoietic lineages (M) in the bone marrow (two tibias + two femurs) from paired 8‐week‐old Lhcgr
−/− and control mice. Data from male and female mice did not significantly differ from each other and were therefore pooled together. All data reflected mean ± SD (n = 6 mice/genotype from three independent experiments). Two‐tailed Student's t‐tests were used to assess the statistical significance between Lhcgr
−/− and control mice (*P < 0.05, **P < 0.01, ***P < 0.001).
-
N
Competitive reconstitution assay in which 300,000 of donor bone marrow cells from 8‐week‐old Lhcgr
−/− or control mice were transplanted along with 300,000 recipient‐type competitor cells into irradiated recipient mice (n = 12 recipient mice/genotype from three independent experiments). Data represented mean ± SD. The statistical significance of differences between Lhcgr
−/− and control mice was assessed using two‐way ANOVAs (*P < 0.05, **P < 0.01).

