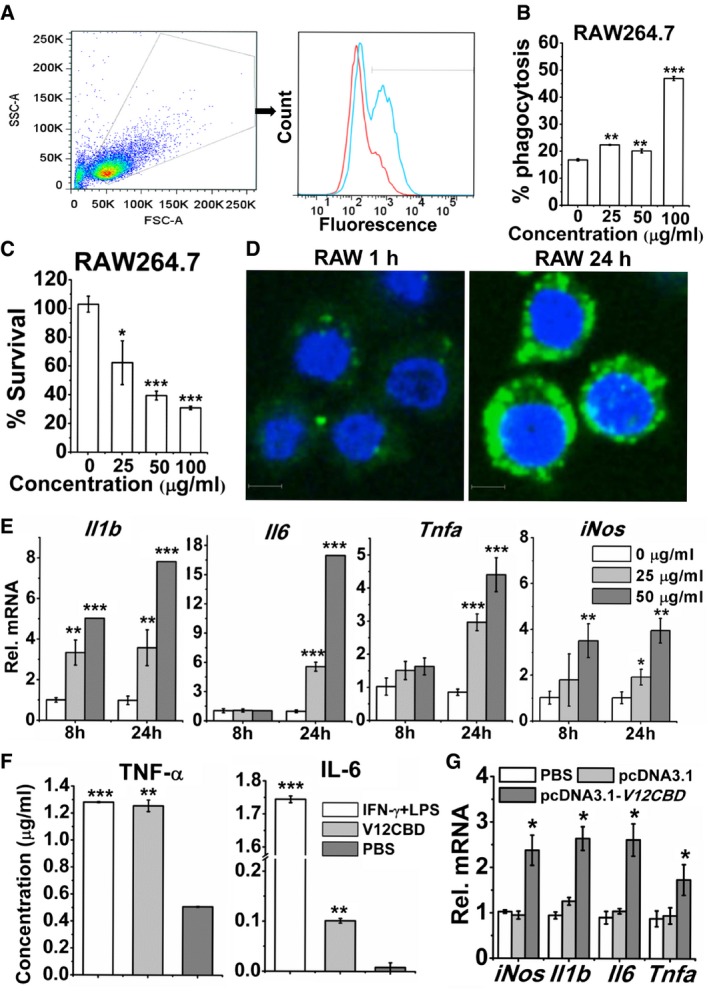
Example FACS plot for phagocytosis of S. aureus by V12CBD‐pretreated macrophages. RAW264.7 cells are pretreated with V12CBD (cyan line) or PBS (red line) for 24 h before the experiment. Then, WGA‐conjugated S. aureus N315 is added and cocultured with RAW264.7 cells for 1 h. After treatment with trypsin and washing with PBS at 300 g for six times, RAW264.7 cells are analyzed using a BD LSRFortessa flow cytometer. Images shown are representative of two independent repeats (n = 3 per group).
Summary data of phagocytosis of S. aureus by macrophages. The extent of phagocytosis after each treatment is analyzed using the CFlow software. n = 6. **P < 0.01, ***P < 0.001.
Survival of S. aureus in RAW264.7 cells pretreated with V12CBD for 24 h. n = 6. *P < 0.05, ***P < 0.001.
Images of RAW264.7 cells after cocultured with Alexa Fluor 488‐labeled V12CBD for 1 and 24 h. Scale bar: 5 μm. Images shown are representative of two independent repeats (n = 3 per group).
Expression levels of Il1b, Il6, Tnfa, and iNos in macrophage RAW264.7 after exposure to 0, 25, and 50 μg/ml V12CBD for 8 and 24 h. n = 6. *P < 0.05, **P < 0.01, ***P < 0.001.
Expression levels of TNF‐α and IL‐6 in the supernatants of RAW264.7 after treated with 100 μg/ml V12CBD for 24 h. Cells treated with a mixture of 15 ng/ml IFN‐γ and 15 ng/ml LPS are used as positive controls. n = 3. **P < 0.01, ***P < 0.001.
Expression levels of Il1b, Il6, Tnfa, and iNos in BHK‐21 cells after transfection with pcDNA3.1 or pcDNA3.1‐V12CBD for 48 h. n = 6. *P < 0.05.
Data information: Data are shown as mean ± SEM. Pairwise comparison is performed using two‐tailed Student's
‐test, unless stated otherwise. All genes' expression levels are compared with that of
gene in the same condition. The PBS‐treated cells were used as blank controls.

