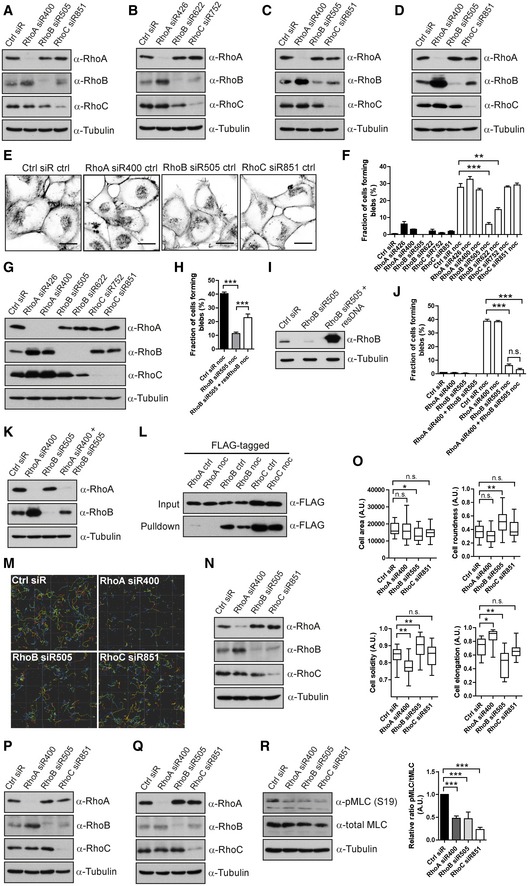
Figure EV1. Effects of RNAi‐mediated knock‐down of Rho family members on cell morphological features and migration.

-
A–DKnock‐down efficiency controls for Fig 1. (A, B) T‐ALL cells; (C) Reh cells; or (D) A375M2 DS cells transfected with Ctrl siRNA or siRNAs against RhoA, RhoB or RhoC; the knock‐down efficiency and potential effect on other Rho proteins were detected by immunoblotting.
-
E, FH1299 cells transfected with Ctrl, RhoA‐, RhoB‐ or RhoC‐siRNAs, treated with or without 1 μM nocodazole (noc) for 30 min, were labelled for F‐actin. (E) Images show H1299 cells treated without nocodazole (Images of H1299 cells treated with nocodazole are shown in Fig 1H). Scale bars, 20 μm. (F) The fraction of cells forming blebs was quantified. Bars show mean ± SEM (n = 3 experiments). Dunnett's multiple comparison test derived P‐values: **P < 0.01; ***P < 0.001. The right half of this graph is also displayed in Fig 1I.
-
GH1299 cells transfected with different Ctrl, RhoA‐, RhoB‐ or RhoC‐siRNAs; the effect of knock‐down of individual siRNAs was detected by immunoblotting.
-
H, IH1299 cells transfected with either RhoB‐siRNA alone or RhoB‐siRNA together with an siRNA‐resistant FLAG‐tagged RhoB construct, treated with nocodazole and labelled for F‐actin. (H) The fraction of cells forming blebs was quantified. Bars show mean ± SEM (n = 4 experiments). Dunnett's multiple comparison test derived P‐values: ***P < 0.001. (I) The level of RhoB was detected by immunoblotting.
-
J, KH1299 cells transfected with Ctrl, RhoA‐, RhoB‐ or RhoA+RhoB‐siRNAs, treated with or without 1 μM nocodazole (noc) for 30 min and labelled for F‐actin. (J) The fraction of cells forming blebs was quantified. Bars show mean ± SEM (n = 3 experiments). Dunnett's multiple comparison test derived P‐values: n.s. = non‐significant; ***P < 0.001. (K) The levels of RhoA and RhoB were detected by immunoblotting.
-
LH1299 cells transfected with FLAG‐tagged RhoA, RhoB or RhoC, treated with or without 1 μM nocodazole (noc) for 30 min. Rho GTPases were pulled down with GST‐RBD protein, and the GTP‐binding activities of RhoA, RhoB and RhoC were detected by immunoblotting with anti‐FLAG antibody.
-
M, NT‐ALL cells electroporated with Ctrl, RhoA‐, RhoB‐ or RhoC‐siRNA, replated in 2.5 mg/ml 3D‐Collagen type I matrix. The cells were imaged, and their migration speed was measured (same data set as in Fig 2A). (M) A representative example of Imaris analysis of T‐ALL cell migration with different Rho protein knock‐down is displayed. (N) Immunoblotting knock‐down efficiency control for Fig 2A.
-
O, PT‐ALL cells electroporated with Ctrl, RhoA‐, RhoB‐ or RhoC‐siRNA, replated in 2.5 mg/ml 3D‐Collagen type I matrix (same data set as in Fig 2D). (O) Cellular features, that is cell area, roundness, solidity and elongation were analysed. The boxes show the median and quartiles, and the whiskers display 5 and 95 percentiles. Kruskal–Wallis test derived P‐values: *P < 0.05; **P < 0.01; n.s.—non‐significant. Data shown are one representative example among three independent experiments. (P) Immunoblotting knock‐down efficiency control for Fig 2D.
-
Q, RT‐ALL cells electroporated with Ctrl, RhoA‐, RhoB‐ or RhoC‐siRNA, replated on FN. The knock‐down efficiency of individual Rho proteins, as well as the levels of phosphorylated and total MLC, was detected by immunoblotting. Bar graph shows quantification of the signal ratio between phospho‐MLC and total MLC as mean ± SD (n = 3 experiments). t‐test (paired, two‐tailed) derived P‐values: ***P < 0.001.
Source data are available online for this figure.
