-
A
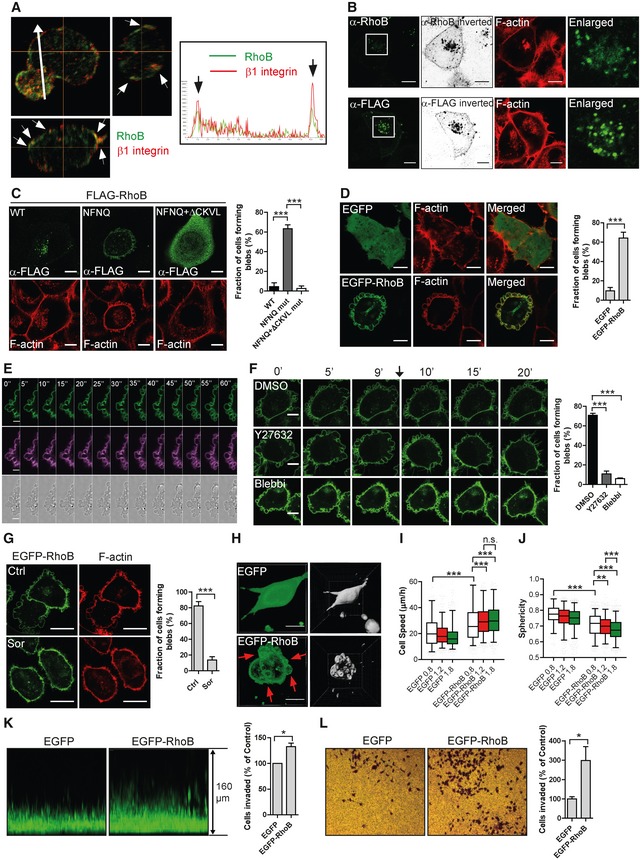
T‐ALL cells replated on FN‐coated surface and immunolabelled for RhoB (green) and β1 integrin (red); Z‐stack with middle focus plane (top left), Y–Z axis projection (top right) and X–Z axis projection (bottom left). Arrowheads indicate co‐localization of RhoB and β1 integrin at the cell periphery. Arrow indicates the direction for the fluorescence intensity quantification along this line shown in the right box. Arrows in the box indicate the RhoB and β1 integrin signals at cell boundaries.
-
B
H1299 cells labelled for F‐actin and immunolabelled either for endogenous RhoB (top) or transfected with FLAG‐RhoB and labelled for FLAG‐tag (bottom). The RhoB/FLAG labelling was imaged in a saturated manner and displayed in an inverted b/w projection. The boxed regions are enlarged and shown to the right.
-
C, D
F‐actin labelled H1299 cells (C) transfected with FLAG‐RhoB WT or different mutants and labelled for FLAG‐tag or (D) stably expressing EGFP or EGFP‐RhoB. Bleb‐positive cells were quantified using the F‐actin channel.
-
E
Live cell imaging time series of EGFP‐RhoB H1299 cell of EGFP‐RhoB (green), CellMask DeepRed plasma membrane dye (violet) and bright field (bottom).
-
F
EGFP‐RhoB H1299 cells were imaged for 10 min, then DMSO, 1 μM Y27632 or 10 μM Blebbistatin (Blebbi) were added and cells continued to be imaged. The arrow indicates the time point of adding inhibitors. The fraction of cells forming blebs was quantified.
-
G
EGFP‐RhoB H1299 cells were treated with or without 0.5 M sorbitol (Sor) for 30 min, fixed and labelled for F‐actin. The fraction of cells forming blebs was quantified.
-
H
EGFP or EGFP‐RhoB H1299 cells replated in 1.8 mg/ml 3D‐Collagen type I gel and imaged. Arrows indicate membrane blebs. The segmentation by Imaris is shown to the right.
-
I, J
EGFP or EGFP‐RhoB H1299 cells in 3D‐Collagen type I gels of different densities (0.8, 1.2 and 1.8 mg/ml) with their migratory behaviours (I, cell speed; J, sphericity) analysed. Boxes show the median and quartiles, and whiskers display the 5 and 95 percentiles.
-
K
EGFP or EGFP‐RhoB H1299 cells invaded into 1.8 mg/ml 3D‐Collagen type I were imaged with a Z‐stack.
-
L
EGFP or EGFP‐RhoB H1299 cells were allowed to invade into Matrigel using transwell chambers. The numbers of invaded cells were normalized.
Data information: Bars show mean ± SD in [C (
n = 3 experiments), D (
n = 6) and K (
n = 4)] or mean ± SEM (
n = 3) in (F, G and L).
t‐test (unpaired, two‐tailed) was performed in (D, G and L);
t‐test (paired, two‐tailed) in (K); Dunnett's multiple comparison test in (C and F); Kruskal–Wallis test in (I and J). *
P < 0.05; **
P < 0.01; ***
P < 0.001; n.s.—non‐significant. Scale bars, 10 μm in (B, C, D and F), 20 μm in (G and H) and 5 μm in (E).
Source data are available online for this figure.

