-
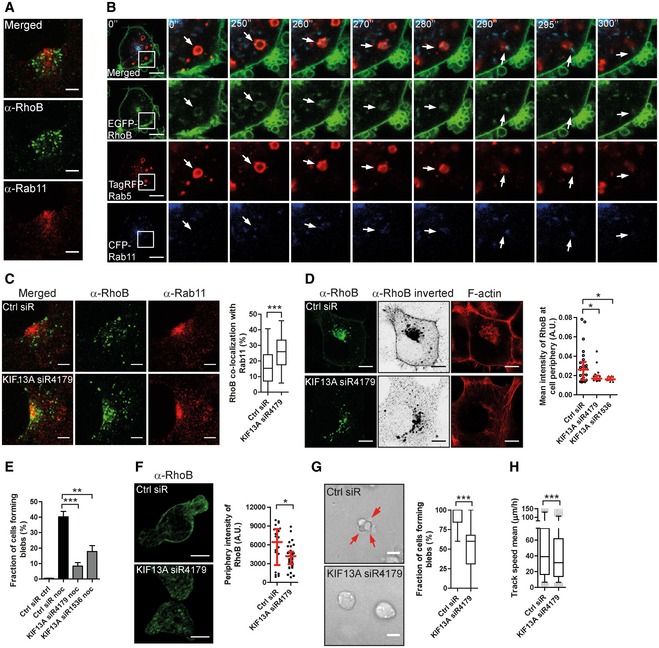
A
H1299 cells fixed and immunolabelled for RhoB and Rab11.
-
B
Imaging time series of EGFP‐RhoB H1299 cells transfected with TagRFP‐Rab5 and CFP‐Rab11. The boxed region is enhanced to the right and displayed over 300 s. The arrows show the transfer of RhoB from a Rab5‐ to a Rab11‐positive vesicle.
-
C
H1299 cells transfected with Ctrl or KIF13A‐siRNA immunolabelled for RhoB and Rab11. The co‐localization of RhoB with Rab11 was quantified.
-
D
H1299 cells transfected with FLAG‐tagged RhoB, together with Ctrl or KIF13A‐siRNAs, immunostained for RhoB. Cells were imaged in a saturated manner for the RhoB channel and displayed in an inverted between projection. The mean intensity of RhoB at the cell periphery (within 1 μm from cell border) was quantified.
-
E
H1299 cells were transfected with Ctrl or KIF13A‐siRNAs and treated with or without 1 μM nocodazole (noc) for 30 min and stained for F‐actin. Cells forming blebs were quantified.
-
F
T‐ALL cells were electroporated with Ctrl or KIF13A‐siRNA, replated on FN‐coated surface and immunostained for RhoB. The mean intensity of RhoB at the cell periphery (within 0.5 μm from cell border) was quantified.
-
G, H
T‐ALL cells electroporated with Ctrl or KIF13A‐siRNA replated in a 2.5 mg/ml 3D‐Collagen type I gel. The fraction of cells forming blebs (G) and 3D cell migration speed (H) was quantified. Red arrows indicate membrane blebs.
Data information: Bars show the median and quartiles among 12–26 cells (D) or 25–37 cells (F), or (E) mean ± SEM (
n = 3 experiments). Boxes show the median and quartiles, and whiskers display the 5 and 95 percentiles among 97–104 cells (C), 149–151 cells (G) and 15,716–20,406 tracks (H).
P‐values derived from Mann–Whitney test (C, F, G and H), Dunnett's multiple comparison test (E) or Kruskal–Wallis test (D): *
P < 0.05; **
P < 0.01; ***
P < 0.001. Scale bars, 5 μm in (A, C and F) and 10 μm in (B, D and G).
Source data are available online for this figure.

