
Figure 5. Identification of YAP‐driven gene signature in BCC tumors.
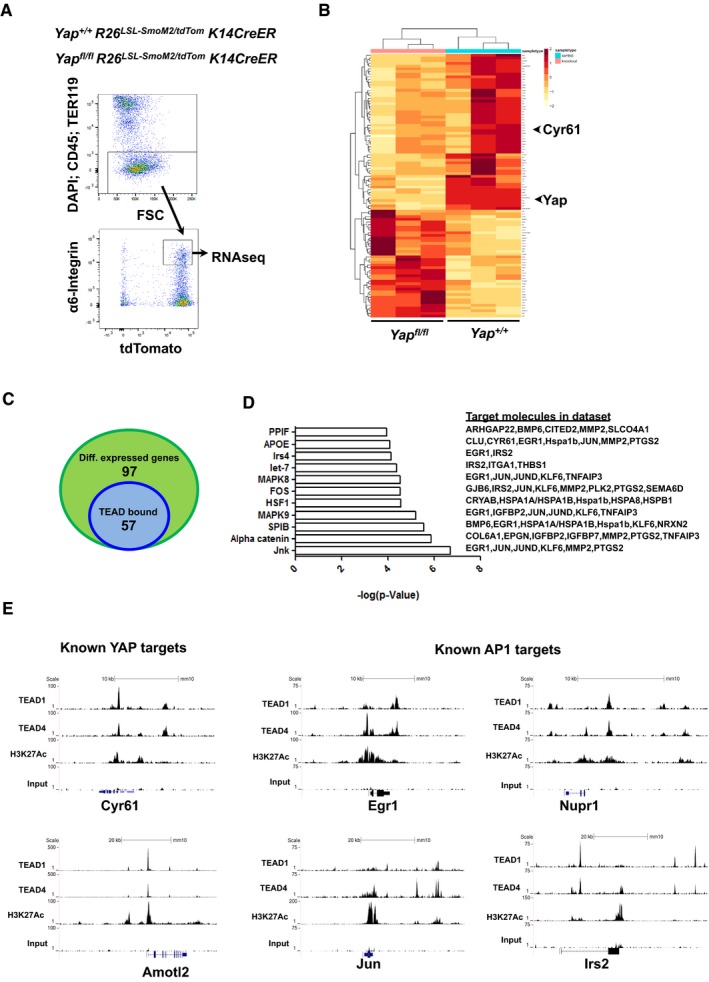
- FACS methodology to purify ear BCC cells from Yap +/+ and Yap fl/fl mice (6 weeks after high‐dose tamoxifen administration) for RNAseq analysis.
- RNAseq heatmap of differentially expressed genes between Yap +/+ and Yap fl/fl BCC.
- Venn diagram of TEAD1/TEAD4 peaks found within differentially expressed genes from Yap‐null BCC.
- Ingenuity Pathway Analysis of differentially expressed genes between Yap +/+ and Yap fl/fl BCC.
- TEAD1, TEAD4, H3K27Ac, and input (control) peaks associated with known YAP targets (Cyr61 and AmotL2) or known AP1 targets (Egr1, Jun, Nupr1, Irs2) from BCC ChIPseq.