
Figure 1. mtDNA is released from mitochondria following MOMP in a BAX/BAK‐dependent manner.
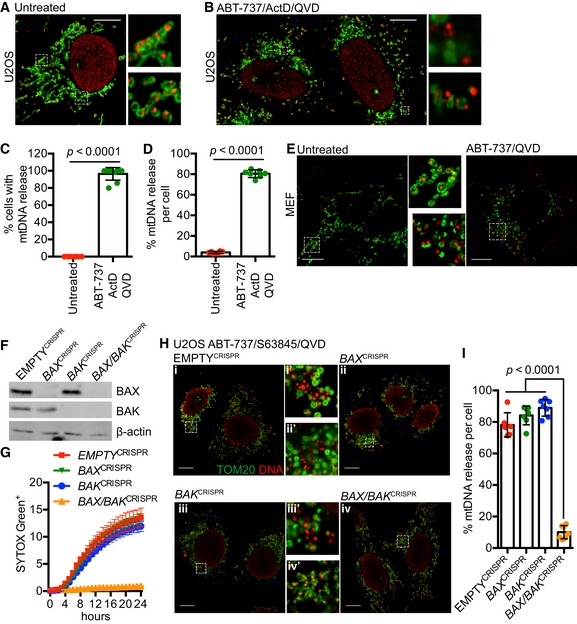
- Fixed super‐resolution Airyscan images of U2OS cells immunostained with anti‐TOM20 (green) and anti‐DNA (red) antibodies. Scale bar = 10 μm. Representative images from three independent experiments.
- Airyscan images of U2OS cells treated with 10 μM ABT‐737, 1 μM ActD and 20 μM qVD‐OPh for 3 h, immunostained with anti‐TOM20 and anti‐DNA antibodies. Scale bar = 10 μm. Representative images from three independent experiments.
- Quantification of cells exhibiting > 10% mtDNA release following treatment with 10 μM ABT‐737, 1 μM ActD and 20 μM qVD‐OPh. Data are expressed as mean ± SD from three independent experiments and analysed by Student's t‐test.
- Quantification of the extent of mitochondrial DNA (mtDNA) nucleoid release per cell following treatment with 10 μM ABT‐737, 1 μM ActD and 20 μM qVD‐OPh. Data are expressed as mean ± SD from two independent experiments and analysed by Student's t‐test.
- Airyscan images of MEF cells untreated or treated with 10 μM ABT‐737 and 20 μM qVD‐OPh for 3 h, immunostained with anti‐TOM20 and anti‐DNA antibodies. Scale bar = 10 μm. Representative images from three independent experiments.
- BAX and BAK expression levels in U2OS cells with CRISPR‐Cas9‐mediated deletion of BAX, BAK or BAX/BAK.
- U2OS cells with BAX, BAK or BAX/BAK deletion by CRISPR‐Cas9 treated with 10 μM ABT‐737 and 2 μM S63845 and analysed for cell viability using an IncuCyte live‐cell imager and SYTOX Green exclusion. Data are expressed as mean ± SEM, representative of three independent experiments, and have been normalised to starting confluency.
- Airyscan images of U2OS (i) control cells or with CRISPR‐Cas9‐mediated deletion of either (ii) BAX, (iii) BAK or (iv) BAX and BAK treated with 10 μM ABT‐737, 2 μM S63845 and 20 μM qVD‐OPh for 3 h. Scale bar = 10 μm. Representative images from three independent experiments.
- Quantification of mtDNA nucleoid release per cell in U2OS EMPTYCRISPR, BAX CRISPR, BAK CRISPR and BAX/BAK CRISPR cells. Data are expressed as mean ± SD from three independent experiments and analysed using Student's t‐test.
Source data are available online for this figure.