
Figure 2. MOMP‐induced mtDNA release initiates a cGAS‐STING‐dependent type I interferon response.
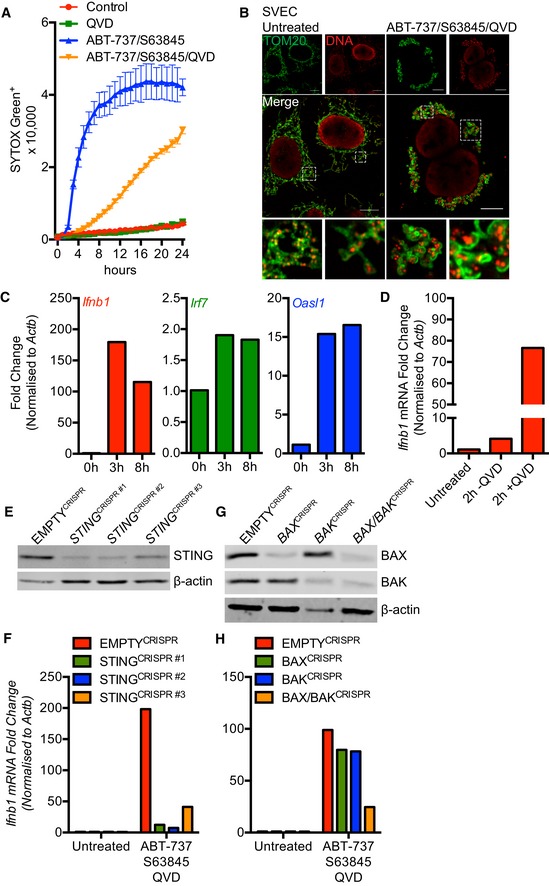
- SVEC cells treated with 10 μM ABT‐737 and 10 μM S63845 ± 20 μM qVD‐OPh. Cell viability was analysed using an IncuCyte live‐cell imager and SYTOX Green exclusion. Data are expressed as mean ± SEM, representative of two independent experiments.
- Airyscan images of SVEC cells treated with 10 μM ABT‐737, 10 μM S63845 and 20 μM qVD‐OPh for 3 h, immunostained with anti‐TOM20 and anti‐DNA antibodies. Scale bar = 10 μm. Representative images from three independent experiments.
- Ifnb1, Irf7 and Oasl1 mRNA expression in SVEC cells treated with 10 μM ABT‐737, 10 μM S63845 and 20 μM qVD‐OPh for 3 h. Data are representative of three independent experiments.
- Ifnb1 mRNA expression in SVEC cells treated with 10 μM ABT‐737, 10 μM S63845 ± 20 μM qVD‐OPh for 2 h. Data are representative of two independent experiments.
- STING expression in CRISPR‐Cas9‐mediated STING‐deleted SVEC cells using three independent sgRNA sequences.
- Ifnb1 mRNA expression in STING CRISPR‐Cas9‐deleted SVEC cells treated with 10 μM ABT‐737, 10 μM S63845 and 20 μM qVD‐OPh for 3 h. Data are representative of two independent experiments.
- BAX and BAK expression in SVEC cells harbouring CRISPR‐Cas9‐mediated deletion of BAX, BAK or BAX/BAK.
- Ifnb1 mRNA expression in BAX, BAK or BAX/BAK CRISPR‐Cas9‐deleted SVEC cells treated with 10 μM ABT‐737, 10 μM S63845 and 20 μM qVD‐OPh for 3 h. Data are representative of two independent experiments.
Source data are available online for this figure.