
Figure EV3. 3D‐SIM analysis of mtDNA release.
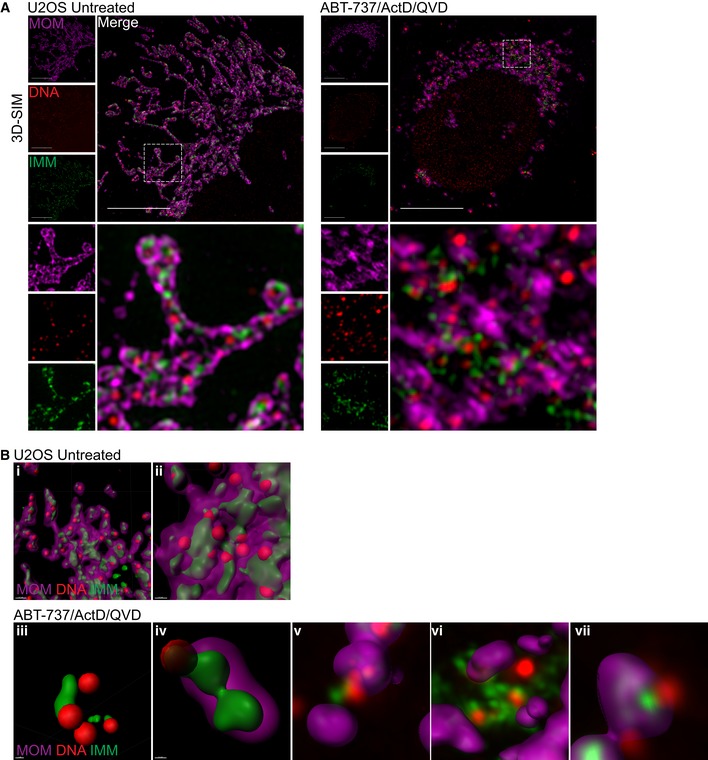
- 3D‐SIM images of U2OS cells treated with 10 μM ABT‐737, 1 μM ActD, and 20 μM qVD‐OPh for 3 h. Prior to treatment cells were labelled with JF646 (to label SNAP‐MOM) and post‐fixation were immunostained for IMM (AIF) and DNA. Scale bar = 10 μm. Representative images from three independent experiments.
- Further examples of untreated (i–ii) and treated (iii–iv) U2OS cells 3D‐rendered for MOM (magenta), AIF (IMM, green), and DNA (red). (v–vii) show only the MOM 3D‐rendered with AIF and DNA in captured form.
Source data are available online for this figure.