
Figure 4. Mitochondrial inner membrane permeabilisation allows mtDNA release into the cytosol.
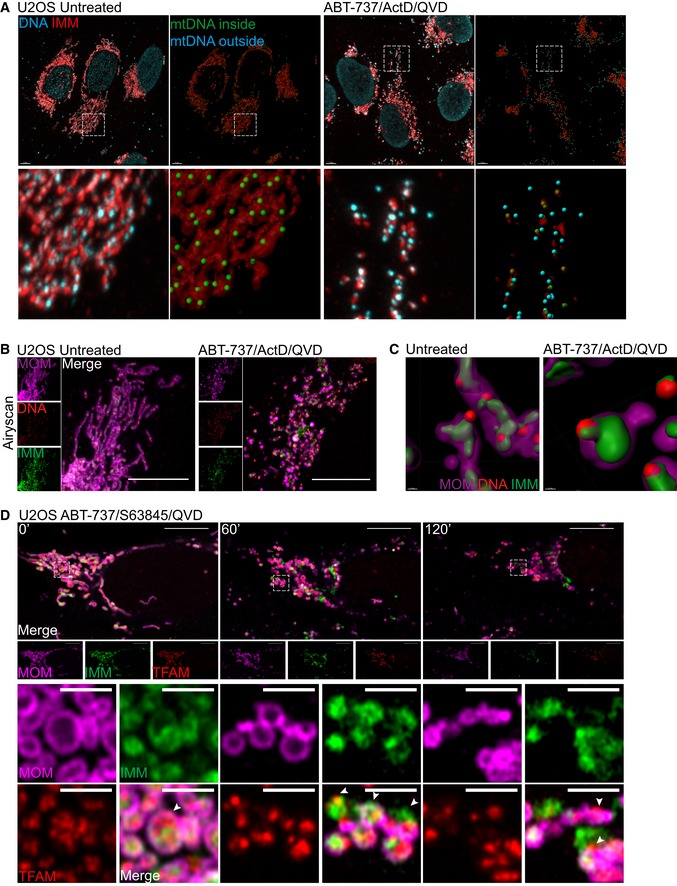
- Maximum intensity projection of Airyscan z‐stack data of U2OS cells treated with 10 μM ABT‐737, 1 μM ActD and 20 μM qVD‐OPh for 3 h. Cells were immunostained with anti‐AIF (IMM) and anti‐DNA antibodies. Z‐stack data were 3D‐rendered in Imaris and mtDNA nucleoid inside and outside the AIF signal were visualised. Scale bar = 5 μm. See [Link], [Link]. Representative images from three independent experiments.
- Airyscan images of U2OS cells stably expressing JF646‐MOM (magenta) treated with 10 μM ABT‐737, 1 μM ActD and 20 μM qVD‐OPh for 3 h and immunostained with anti‐DNA (red) and anti‐AIF (IMM, green) antibodies. Scale bar = 10 μm. Representative images from three independent experiments.
- Imaris 3D‐renderings of MOM (magenta), AIF (green) and DNA (red) from U2OS cells treated as in (B).
- U2OS cells stably expressing JF646‐MOM (magenta) and transiently expressing TFAM‐mScarlet (red) and AIF (1‐90)‐mClover (green) live‐cell imaged by Airyscan. Cells were treated with 10 μM ABT‐737, 2 μM S63845 and 20 μM qVD‐OPh at t = 0. Scale bar = 10 and 2 μm for zooms. See Video EV7. Representative images from two independent experiments. Numbers indicate time in minutes. Arrowheads indicate instances of released TFAM.