
Figure EV4. mtDNA release is independent of mitochondrial fission and the mitochondrial permeability transition pore.
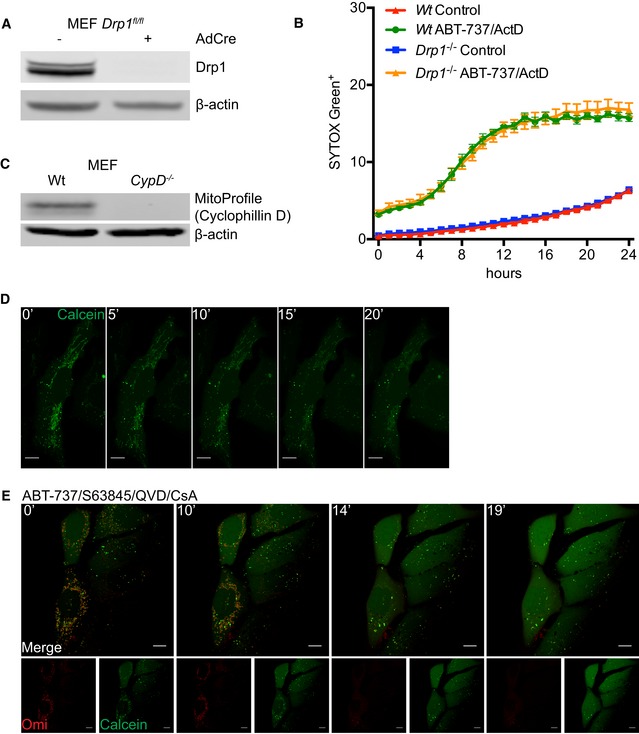
- Expression of Drp1 protein in Wt and Drp1‐deleted MEFs.
- IncuCyte live‐imaging of SYTOX Green exclusion in Wt and Drp1‐deleted cells treated with 10 μM ABT‐737 and 1 μM ActD to assess cell viability. Data are expressed as mean ± SEM, representative of two independent experiments and have been normalised to starting confluency.
- Expression of CypD protein in Wt and CypD‐deleted MEFs.
- U2OS cells loaded with calcein‐AM and CoCl2 and imaged every 30 s for 20 min to show absence of photobleaching. Scale bar = 10 μm. Numbers indicate time in minutes.
- Images from time‐lapse live‐cell imaging of U2OS cells loaded with calcein‐AM and CoCl2 and treated with 10 μM ABT‐737, 2 μM S63845 and 20 μM qVD‐OPh in the presence of 25 μM CsA at t = 0. Scale bar = 10 μm. See Video EV9. Representative images from two independent experiments. Numbers indicate time in minutes.