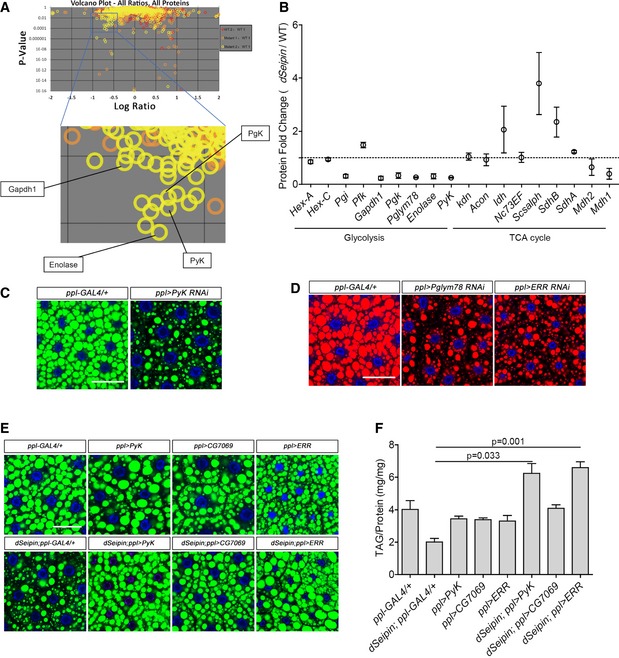
Volcano plots of iTRAQ proteomics analysis of third‐instar larval fat bodies (top). Four glycolytic proteins are indicated in the zoomed frame (bottom). The volcano plots show the logarithm‐transformed ratios of all quantitative proteins in different samples (x‐axis, WT2:WT1, red circles; Mutant1:WT1, orange‐yellow; Mutant2:WT1, yellow) versus the probability that the difference from the unity ratio (1:1) is random (P‐values on the y‐axis). The target‐decoy method was used to estimate the false discovery rate (FDR). The channels WT1 and WT2 are two equivalent biological replicates of the wild‐type control, and the ratio of WT2:WT1 was assigned as the decoy. The channels Mutant1 and Mutant2 are two equivalent biological replicates for the dSeipin mutant, and the ratios of Mutant1:WT1 and Mutant2:WT1 were assigned as the targets.
Data mining from (A). The levels of most glycolytic proteins are dramatically decreased in dSeipin mutant fat cells, while the enzymes of the TCA cycle are not reduced (two replicates for each phenotype).
BODIPY staining of lipid droplets in third‐instar larval fat bodies of PyK RNAi and ppl‐GAL4 control. Nuclei were stained by DAPI.
Nile red staining of lipid droplets in third‐instar larval fat bodies of Pglym78 RNAi, ERR RNAi, and ppl‐GAL4 control. Nuclei were stained by DAPI.
Overexpressing PyK or ERR in dSeipin mutant fat bodies rescues the lipid storage phenotype. Lipid droplets were stained by BODIPY, and nuclei were stained by DAPI.
TAG levels in third‐instar larval fat bodies of different genetic backgrounds, related to (E). TAG levels were normalized to protein content (n = 5, fat bodies from ≥ 10 larvae were used for each repeat).
Data information: Scale bars represent 50 μm (C–E). Error bars represent ±SEM (B and F), and statistical analyses were performed with one‐way ANOVA with a post‐Tamhane's T2 test (F).