
Figure 2. The TCA cycle is downregulated in dSeipin mutant fat bodies.
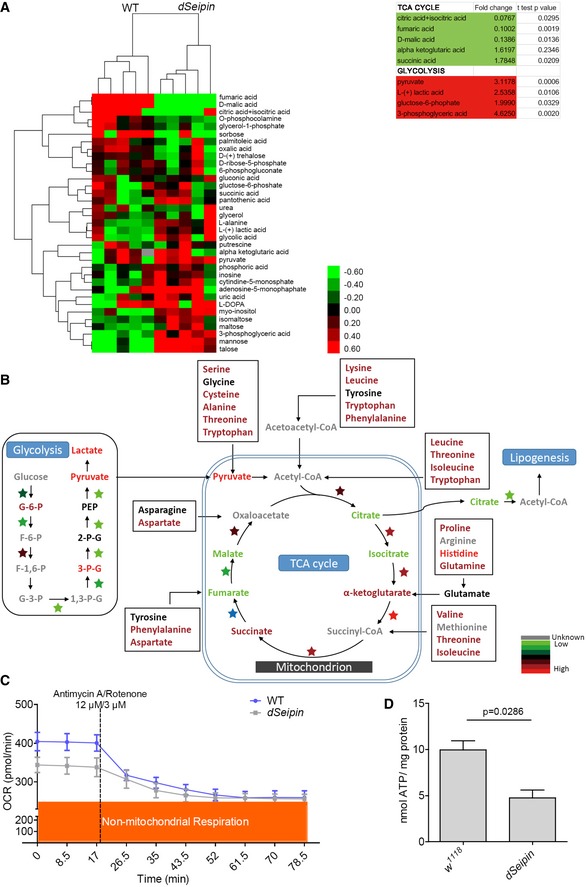
- Hierarchical clustering analysis (HCA) of GC/MS metabolomics data. The colors indicate the relative levels in dSeipin mutant or WT cells. Note that the top three metabolites in the cluster are from the TCA cycle. The fold change and t‐test P‐value are shown in the right panel for several metabolites in the TCA cycle and glycolysis.
- Schematic diagram of metabolic pathways combining the quantitative metabolomics and proteomics data. The metabolites are color‐coded to represent their relative levels in dSeipin mutant third‐instar larval fat tissues compared to WT. The color‐coded stars represent different enzymes, and the colors indicate the relative protein levels in dSeipin mutant cells compared to WT.
- Oxygen consumption rate of third‐instar larval fat bodies (n = 4, fat bodies from 20 larvae were used per well).
- Intracellular ATP levels of third‐instar larval fat bodies (n = 4, fat bodies from ≥ 20 larvae were used for each repeat).