
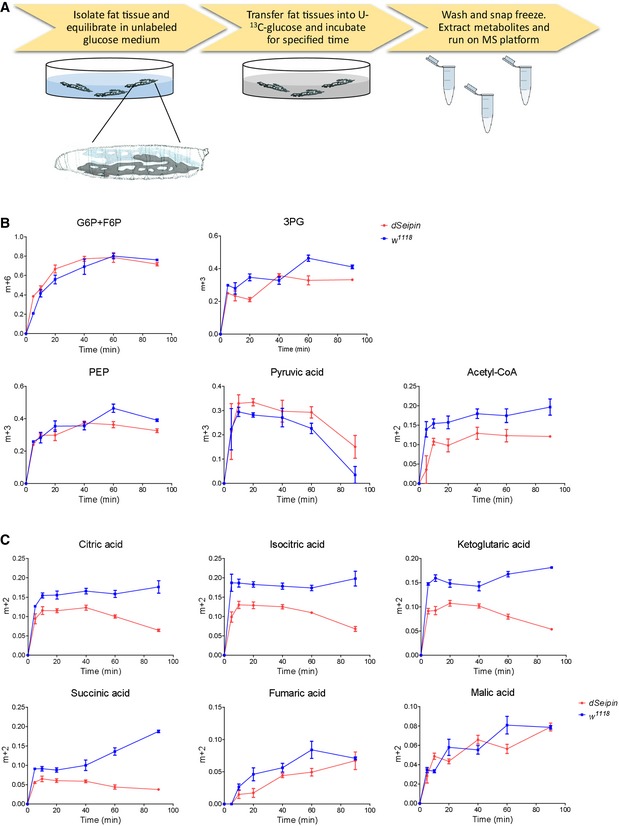
Figure 3. Carbon metabolic flux tracing from isotopic labeled glucose in larval fat bodies.
-
ASchematic of the experimental procedure for U‐13C glucose labeling of isolated Drosophila larval fat tissues.
-
B, CTime‐course fractional 13C labeling of glycolytic metabolites and acetyl‐CoA (B) and TCA cycle metabolites (C) in the fat tissue after incubating with U‐13C‐glucose. The y‐axis in the graphs represents the ratio of intensities (area under the curve) of the labeled mass isotopomers to the sum of the labeled and unlabeled mass isotopomers for a given metabolite. n = 5 for each time point. Fat bodies from 15 larvae were used for each repeat. Error bars represent ±SEM.