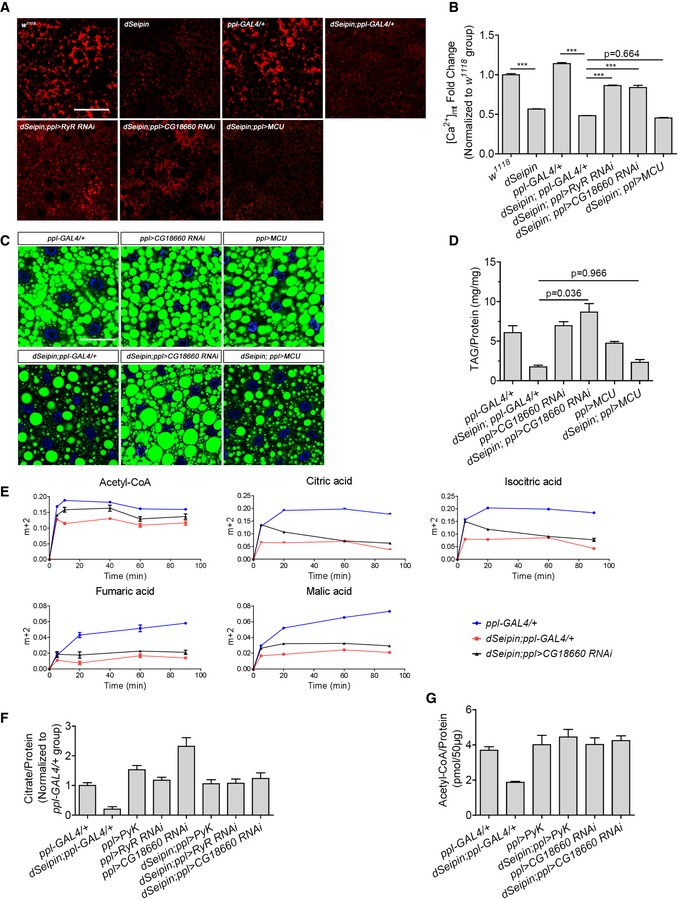
Rhod‐2 staining indicates the mitochondrial calcium levels in third‐instar larval fat bodies of different genetic backgrounds.
Mean red fluorescence intensity per unit area measured by ImageJ software. Related to (A) (six independent images for each calculation).
Knockdown of CG18660 in dSeipin mutant fat bodies rescues the lipid storage phenotype. Lipid droplets are stained by BODIPY and nuclei are stained by DAPI.
Determination of TAG levels in third‐instar larval fat bodies of different genetic backgrounds, related to (C) (n = 5, fat bodies from ≥ 10 larvae were used for each repeat).
Time‐course fractional 13C labeling of acetyl‐CoA and selected TCA cycle metabolites in fat tissues after incubation with U‐13C‐glucose. The y‐axis in the graphs represents the ratio of intensities (area under the curve) of labeled mass isotopomers to the sum of the labeled and unlabeled mass isotopomers for a given metabolite (n = 3 for each time point, fat bodies from 15 larvae were used for each repeat).
Measurement of citrate levels in third‐instar larval fat bodies of different genetic backgrounds (n = 3, fat bodies from 20 larvae were used for each repeat).
Measurement of acetyl‐CoA levels in third‐instar larval fat bodies of different genetic backgrounds (n = 3, 15 independent fat bodies for each repeat).
Data information: Scale bar represents 50 μm (A and C). Error bars represent ±SEM (B and D–G) and statistical analyses were performed with one‐way ANOVA with a post‐Tukey's multiple comparison test (B) or post‐Tamhane's T2 test (D). ***
< 0.001.