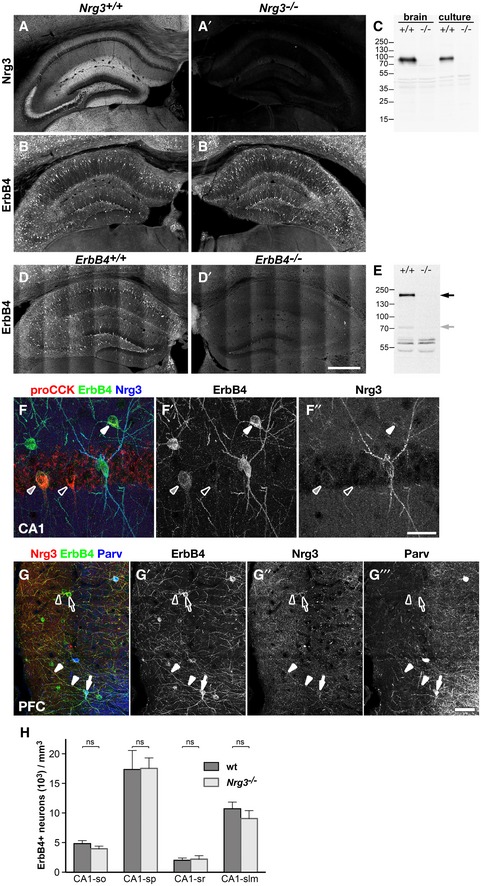
Figure EV1. Specificity of anti‐Nrg3 and anti‐ErbB4 antibodies, Nrg3/ErbB4 co‐clustering on PV‐negative neurons, and ErbB4 interneuron numbers in the hippocampus of Nrg3 mutant mice.

-
A, BHippocampus sections from wildtype (A, B) and Nrg3 −/− mice (A′, B′), age P35, were immunostained for Nrg3 (A, A′) and ErbB4 (B, B′). Nrg3 is widely distributed throughout the neuropil with higher levels being associated with ErbB4+ interneurons (A). Nrg3 immunostaining is abolished in Nrg3 mutant tissue (A′), ErbB4 levels are unchanged (B, B′).
-
CWestern blot analysis of lysates from cortical tissue (brain) and cultured cortical neurons (culture). The anti‐Nrg3 antibody detects a main band of about 95 kD (arrow) in lysates from wildtype (+/+) but not from Nrg3 mutant mice (−/−).
-
DHippocampus sections from wildtype (D) and heart‐rescued ErbB4 mutant mice (D′), 2 months of age, were immunostained for ErbB4. ErbB4 immunostaining is detected in wildtype (D) but not ErbB4 mutant hippocampus (D′).
-
EWestern blot analysis of lysates from cortical tissue. The anti‐ErbB4 antibody detects a main band of 180 kD (black arrow) and a minor band of about 70 kD (gray arrow) in lysates from wildtype (+/+) but not from ErbB4 mutant mice (−/−).
-
FHippocampus section was immunostained against pro‐CCK, ErbB4, and Nrg3; shown is the stratum pyramidale of CA1. CCK+ interneurons express variable amounts of ErbB4 as indicated by white (high expression), gray (middle), and open arrowheads (no detectable ErbB4). Association of Nrg3 with soma or dendrites of CCK+ interneurons is not detectable.
-
GSection of the prefrontal cortex was immunostained against Nrg3, ErbB4, and parvalbumin (Parv). Nrg3 is co‐localized with ErbB4 on soma and dendrites of PV‐positive (filled arrow and arrowheads) and PV‐negative neurons (open arrow and arrowheads).
-
HDensities of ErbB4+ interneurons in different layers of the hippocampal CA1 region are identical in adult wildtype and Nrg3 mutant mice at postnatal days 90–120; so, stratum oriens; sp, stratum pyramidale; sr, stratum radiatum; slm, stratum lacunosum‐moleculare. Data represent mean ± SD of six biological replicates for each genotype. Two‐way ANOVA with Bonferroni's multiple comparisons test was performed to assess statistical significance (ns = not significant). Scale bars: 500 μm (D′), 40 μm (F″), 50 μm (G‴).
Source data are available online for this figure.
