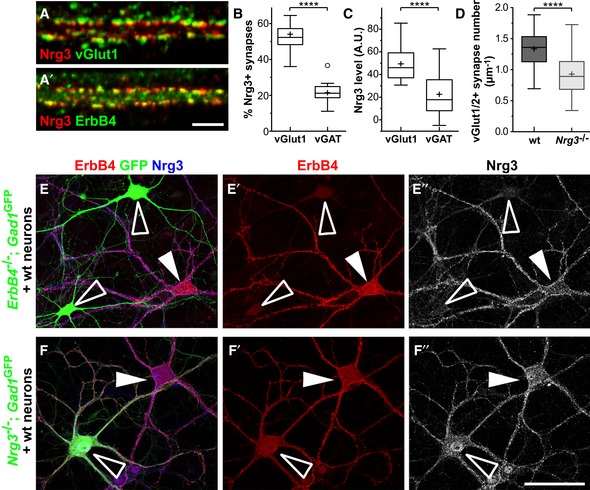
Hippocampal neurons cultured for 21 days were analyzed by immunocytochemistry using antibodies against Nrg3, ErbB4, and vGlut1, demonstrating co‐clustering of Nrg3 and ErbB4 in excitatory synapses. Note that (A) displays Nrg3/vGlut1 and (A′) Nrg3/ErbB4 signals of the same triple‐stained image.
Quantification of the proportions of vGlut1/2+ and vGAT+ presynaptic boutons that are positive for Nrg3 (two‐tailed Wilcoxon test, ****P < 0.0001, n = 18 from two independent experiments).
Quantification of Nrg3 immunofluorescence levels in vGlut1/2+ and vGAT+ presynaptic boutons that are positive for Nrg3 (A.U., arbitrary units, two‐tailed Wilcoxon test, ****P < 0.0001, n = 17 from two independent experiments).
Quantification of vGlut1/2+ synapse numbers on secondary dendrites of PV interneurons in cultures from wildtype (wt) and Nrg3
−/− mice (21–24 days in culture). Data from n = 27 (wt) and n = 26 (Nrg3
−/−) neurons from three independent experiments were analyzed using two‐tailed Mann–Whitney U‐test, ****P < 0.0001.
Immunocytochemical analysis of a mixed culture containing neurons of wildtype and ErbB4
−/−;Gad1/Gad67‐GFP animals triple‐stained against ErbB4, GFP, and Nrg3. To improve the visibility, ErbB4 and Nrg3 signals are also shown separately (E′, E″). ErbB4+ interneurons from wildtype animals are indicated by filled arrowheads, and interneurons from ErbB4
−/− mice were identified by GFP and are indicated by open arrowheads.
Immunocytochemical analysis of a mixed culture containing neurons from wildtype and Nrg3
−/−
;Gad1/Gad67‐GFP animals triple‐stained against ErbB4, GFP, and Nrg3. To improve visibility, ErbB4 and Nrg3 signals are also shown separately (F′, F″). ErbB4+ interneurons from Nrg3
−/− animals are GFP‐positive and are indicated by open arrowheads; ErbB4+ interneurons from wildtype animals are GFP‐negative and are indicated by filled arrowheads.
Data information: Scale bars: 10 μm (A′) and 50 μm (F″). Data in (B–D) are presented as box plots with Tukey's whiskers and outliers; means are indicated by plus symbols.

