-
A
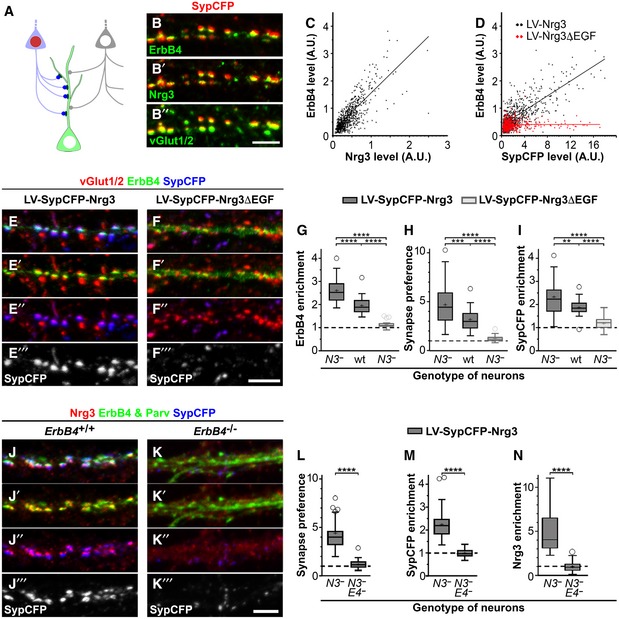
Schematic display of the culture model using hippocampal neurons that were infected by a lentivirus co‐expressing a synaptophysin‐CFP fusion protein (SypCFP) together with either Nrg3 or Nrg3ΔEGF at a low titer so that 10–20% of the hippocampal neurons were transduced with the lentivirus (depicted as a light blue colored neuron with a red nucleus). Presynaptic boutons formed by non‐transduced (depicted as a light gray neuron with a white nucleus) and transduced neurons can be distinguished by the absence or presence of CFP labeling (gray and blue boutons, respectively).
-
B
Hippocampal Nrg3
−/− neurons after transduction with lentivirus co‐expressing SypCFP/Nrg3 were analyzed by immunocytochemistry. (B) Antibodies against CFP, ErbB4, Nrg3, and vGlut1/2; (B), (B′), and (B″) show the same image and display SypCFP/ErbB4, SypCFP/Nrg3, and SypCFP/vGlut1/2 signals, respectively. The images were assigned false colors for better visualization of the signals. SypCFP, Nrg3, and ErbB4 co‐localize in excitatory vGlut1/2+ synapses.
-
C, D
Correlation analyses of the levels of ErbB4 and Nrg3 (C) or ErbB4 and SypCFP (D) staining in vGlut1/2+ synapses; every dot corresponds to one synapse. Cultured Nrg3
−/− neurons were transduced with either SypCFP/Nrg3 (black in C, D) or SypCFP/Nrg3ΔEGF (red in D) lentiviruses.
-
E, F
Hippocampal
Nrg3
−/− neurons were transduced with (E) SypCFP/Nrg3 or (F) SypCFP/Nrg3ΔEGF viruses and immunostained for vGlut1/2, ErbB4, and SypCFP. Both viruses express similar amounts of protein (Fig
EV2). In cultures transduced with the SypCFP/Nrg3 virus, synaptic enrichment of ErbB4 and SypCFP was very pronounced, but not in cultures transduced with the SypCFP/Nrg3ΔEGF virus. Note that (E–E‴) and (F–F‴) display the same images, but color channels were separated for better visualization.
-
G
ErbB4 enrichment in synapses formed in hippocampal cultures after infection with either the SypCFP/Nrg3 or the SypCFP/Nrg3ΔEGF virus. We compared neuronal cultures of different genotypes (Nrg3
−/− and wildtype cultures indicated by N3
− and wt, respectively). ErbB4 enrichment was calculated as the level of ErbB4 in synapses formed by infected neurons (vGlut1/2+/SypCFP+ boutons) divided by the level of ErbB4 in synapses formed by uninfected neurons (vGlut1/2+/SypCFP‐ boutons). The dashed line indicates a ratio of 1 at which SypCFP‐positive and SypCFP‐negative boutons would behave identical.
-
H
Quantification of the preference for neurons expressing SypCFP/Nrg3 or SypCFP/Nrg3ΔEGF to form synapses on ErbB4+ neurons. The synapse preference was calculated as the proportion of vGlut1/2 boutons containing SypCFP that were present on ErbB4‐positive neurons divided by the proportion of such boutons present on ErbB4‐negative neurons.
-
I
Quantification of SypCFP enrichment in excitatory synapses on ErbB4+ neurons. Enrichment was determined as the ratio between SypCFP levels in SypCFP+/vGlut1/2 boutons on ErbB4‐positive and ErbB4‐negative neurons.
-
J, K
Hippocampal neurons from Nrg3
−/− (J) and Nrg3
−/−;ErbB4
−/− (K) mice were transduced with the SypCFP/Nrg3‐expressing virus and immunostained for Nrg3, ErbB4/parvalbumin and SypCFP. Nrg3 and SypCFP were strongly enriched in synapses on dendrites of PV neurons in Nrg3
−/− (J) but not Nrg3
−/−;ErbB4
−/− cultures (K).
-
L–N
Quantification of synapse preference (L), enrichment of SypCFP (M) and of Nrg3 (N) in Nrg3
−/− (N3
−) and Nrg3
−/−;ErbB4
−/− (N3
−
E4
−) hippocampal cultures transduced with the SypCFP/Nrg3 lentivirus. Synapse preference (L) was calculated as the proportion of vGlut1/2 boutons containing SypCFP present on parvalbumin‐positive neurons divided by the proportion of such boutons present on parvalbumin‐negative neurons. SypCFP enrichment (M) was determined as the ratio of SypCFP levels in SypCFP/vGlut1/2+ boutons present on parvalbumin‐positive and parvalbumin‐negative neurons. Nrg3 enrichment (N) was determined as the ratio of Nrg3 levels in SypCFP+/vGlut1/2+ boutons present on parvalbumin‐positive and parvalbumin‐negative neurons.
Data information: Scale bars: 5 μm (B″, F‴, K‴). (G–I) Data from
= 29 (LV‐Nrg3ΔEGF) samples from more than three independent experiments were analyzed. (L–N) Data from
= 45 (LV‐Nrg3ΔEGF, not shown in graphs) samples from more than three independent experiments were analyzed. Data in (G–I, L–N) are presented as box plots with Tukey's whiskers and outliers; means are indicated by plus symbols. One‐way ANOVA with Tukey's multiple comparisons test was performed to assess statistical significance (****
< 0.01).

