-
A
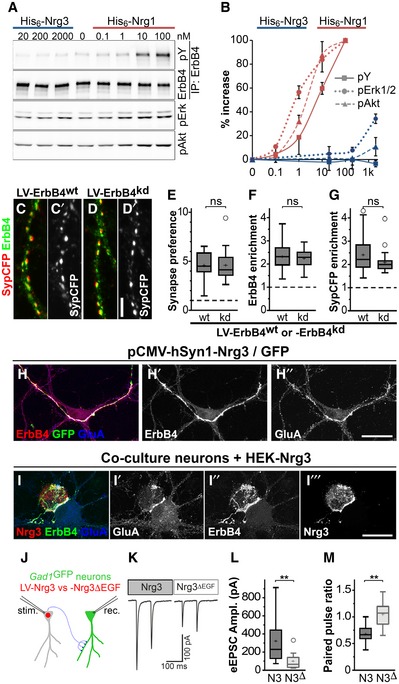
His6‐tagged EGF domains of Nrg1β and Nrg3 were added to neuronal cultures at the indicated concentrations. Western blot analyses of ErbB4 immunoprecipitates using antibodies against phospho‐tyrosine (pY) and ErbB4, and of whole lysates using antibodies against pErk1/2 and pAkt.
-
B
Quantification of Nrg1 and Nrg3‐dependent changes in phosphorylation of ErbB4, Erk1/2 and Akt normalized to input, where 100% corresponds to the maximal change observed for His6‐Nrg1β. Data represent mean ± SD from three independent experiments.
-
C, D
Neurons from Nrg3
−/−;ErbB4
flox/−
;vGAT‐Cre mice were transduced with a lentivirus expressing either (C) ErbB4wt or (D) ErbB4kd (kinase‐dead ErbB4) in a Cre‐dependent manner, and with a second virus at a low titer expressing Nrg3/SypCFP. Immunocytochemical analysis of ErbB4 and SypCFP; (C, C′) and (D, D′) each show the same image, and (C′, D′) show the SypCFP signal.
-
E–G
Quantification of Synapse preference toward ErbB4+ neurons (E), ErbB4 enrichment (F), and SypCFP enrichment (G) in synapses on neurons expressing wildtype ErbB4 (wt) or ErbB4kd (kd).
-
H
Nrg3
−/− neuron cultures were transfected with a plasmid that strongly overexpresses Nrg3 and GFP and immunostained with antibodies against ErbB4, GFP, and GluA; (H) shows the triple‐stained image, while (H′) and (H″) only show ErbB4 and GluA signals, respectively.
-
I
Co‐cultures of Nrg3
−/− neurons with HEK293 cells expressing Nrg3. Cultures were stained with antibodies against Nrg3, ErbB4, and GluA. Note that Nrg3, ErbB4, and GluA are enriched at the contact sites between Nrg3‐expressing HEK293 cells and ErbB4+ neurons.
-
J
Schematic diagram of the strategy used to obtain paired recordings in cultures obtained from Nrg3
−/−;Gad1/Gad67GFP mice. Inhibitory neurons were identified by GFP expression. The cultures were transduced with lentiviruses expressing either Nrg3 or Nrg3ΔEGF (N3 and N3Δ, respectively) together with nuclear red fluorescence protein (nRFP). Transduced neurons, identified by nuclear RFP fluorescence, were stimulated, and evoked responses were recorded from interneurons that were GFP‐positive and nRFP‐negative at 12–15 days in culture.
-
K–M
Sample traces of paired recordings (K), quantification of the amplitude of the evoked excitatory postsynaptic currents (eEPSCs) (L), and quantification of paired pulse ratios (M).
Data information: Scale bars: 5 μm (D′) and 25 μm (H″, I‴). (E–G) Data from
n = 27 (LV‐Nrg3, ErbB4
wt),
n = 27 (LV‐Nrg3, ErbB4
kd), and
n = 29 (LV‐Nrg3ΔEGF, not shown) samples from three independent experiments were analyzed using one‐way ANOVA with Tukey's multiple comparisons test to assess statistical significance (ns = not significant). (L, M) Data from
n = 8 (LV‐Nrg3) and
n = 9 (LV‐Nrg3ΔEGF) from more than three independent experiments were analyzed using (L) Mann–Whitney
U‐test (unpaired, two‐tailed) and (M)
t‐test (unpaired, two‐tailed) to assess statistical significance (**
P < 0.01). Data in (E–G, L, M) are presented as box plots with Tukey's whiskers and outliers. The means are indicated by plus symbols.
Source data are available online for this figure.

