-
A
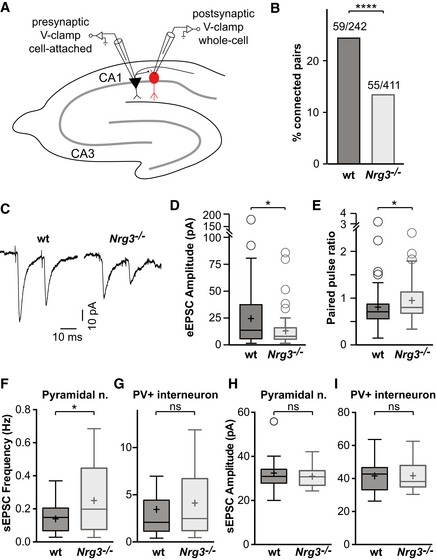
Schematic outline of the connectivity analyses performed in hippocampal slices. PV inhibitory cells (shown in red) were identified using a genetically encoded fluorescence marker (ParvCre;Ai14flox) and recorded from. Neighboring pyramidal neurons were stimulated to probe for connectivity to the recorded interneuron.
-
B
Quantification of the proportion of connected vs. unconnected pyramidal neurons in slices from wildtype (wt) and Nrg3 mutants. Data are presented as bars, and the numbers of connected/tested neuron pairs from 20 wildtype and 30 mutant mice are displayed. Chi‐square test was performed to assess statistical significance (****P < 0.0001).
-
C
Example traces of evoked excitatory postsynaptic currents (eEPSCs) averaged over 50 sweeps.
-
D, E
Quantification of the peak amplitude of the first eEPSC (D) and of the paired pulse ratio (E).
-
F–I
sEPSC recordings from CA1 pyramidal (F, H) and PV neurons (G, I) in acute slices. sEPSC frequencies (F, G) and amplitudes (H, I) are shown.
Data information: (D–E) Data from
n = 59 (wt) and
n = 55 (
Nrg3
−/−) neuron pairs from 20 wildtype and 30
Nrg3
−/− mutant mice were analyzed using Mann–Whitney
U‐test (unpaired, two‐tailed, *
P < 0.05). Means ± SD of eEPSC amplitudes shown in (D): wt 24.9 ± 30.4 pA,
Nrg3
−/− 13.6 ± 16.6 pA. Means ± SD of paired pulse ratio (PPR) shown in (E): wt 0.81 ± 0.47,
Nrg3
−/− 0.94 ± 0.40. (F–I) Data from
n = 17 wildtype and 16
Nrg3
−/− pyramidal neurons and
n = 17 wildtype and 13
Nrg3
−/− PV interneurons recorded in slices of five wildtype and seven
Nrg3
−/− mice were analyzed using unpaired two‐tailed
t‐test (*
P < 0.05; ns, not significant). Data in (D–I) are presented as box plots with Tukey's whiskers and outliers; means are indicated as plus symbols.

