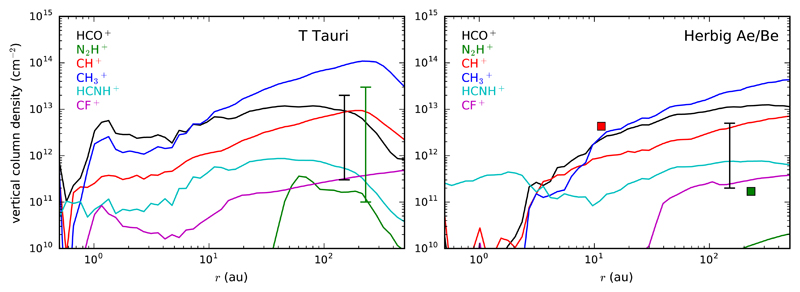
Fig. 11.
Calculated vertical column densities (down to the midplane) of selected molecular ions as a function of radius r for the T Tauri (left panel) and Herbig Ae/Be (right panel) disks. Column densities derived from observations are indicated by vertical lines or squares, with their radial locations corresponding to the approximate region probed by observations (see Table 3).

