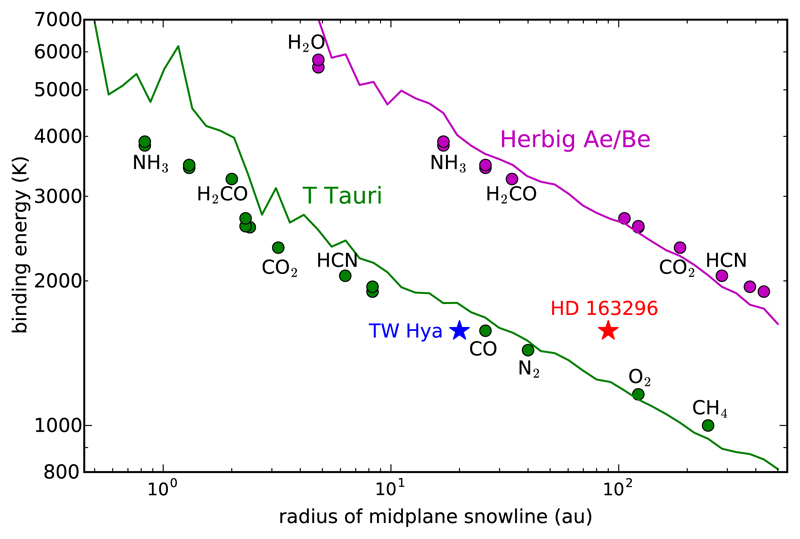
Fig. 13.
Midplane snowline of various ices (along x-axis) as a function of the binding energy (along y-axis) in the T Tauri (green circles) and Herbig Ae/Be (magenta circles) disks. Observational CO snowlines in TW Hya (Schwarz et al. 2016; Zhang et al. 2017) and HD 163296 (Qi et al. 2015) are also shown. We also plot the dust temperature in the midplane (scaled up by a factor of 45) as a function of radius in the T Tauri (green solid line) and Herbig Ae/Be (magenta solid line) disk models.

