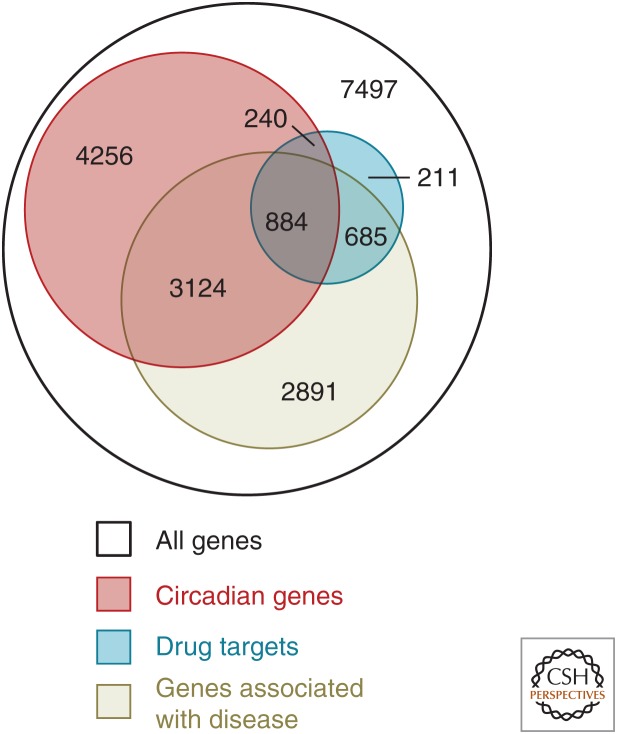
Figure 5.
Schematic representation of the overlap between circadian genes and those with important medical relevance. The figure shows the overlap between genes that have a circadian oscillation (red), those known to be associated with disease (tan), and those that are targets of the 100 top-selling drugs in the United States (blue). Few of the drugs are prescribed with specific timing information, representing potential targets for development of chronopharmacology to improve efficacy and/or reduce side effects. (Panel A from Zhang et al. 2014; reprinted, with permission, from the National Academy of Sciences © 2014.)

