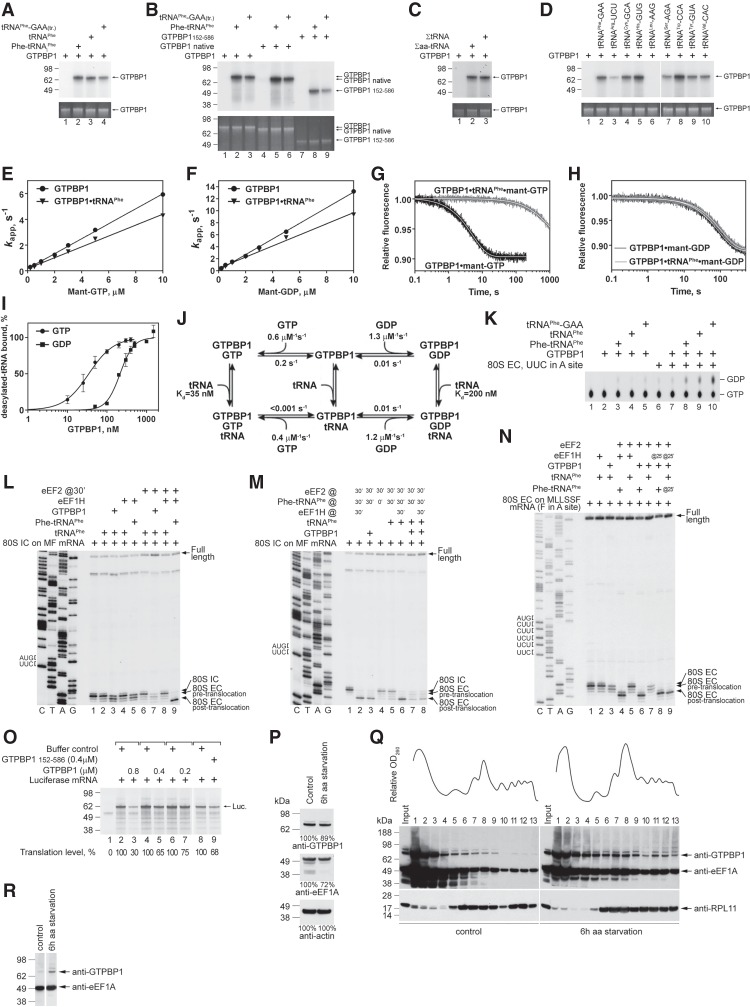
Figure 5.
The activities of GTPBP1 in the presence of deacylated tRNA. (A–D) UV cross-linking of different forms of GTPBP1 to [α-32P]GTP in the presence or absence of aminoacylated and deacylated tRNAs, as indicated. Cross-linked proteins were analyzed by SDS-PAGE followed by autoradiography. (Bottom panels) To ensure equal loading, GTPBP1 levels were analyzed by fluorescent Sypro staining. (E–H) Kinetics of binding of mant-GTP and mant-GDP to GTPBP1. (E,F) Concentration dependence of kapp1 of mant-GTP (E) and mant-GDP (F) binding to GTPBP1 in the presence or absence of tRNAPhe (data in the absence of tRNAPhe are the same as in Fig. 2F,I). (G,H) Time courses of the dissociation of mant-GTP (G) or mant-GDP (H) from GTPBP1 alone or in the presence of tRNAPhe upon chase with 500 µM GTP or 500 µM GDP, respectively. (I) Association of GTPBP1 with [32P]tRNAPhe depending on the presence of guanine nucleotides, assayed by filter binding. (J) The kinetic scheme of the interaction of GTPBP1 with guanine nucleotides and deacylated tRNA. (K) GTP hydrolysis by full-length GTPBP1 in the presence or absence of combinations of ECs and aminoacylated/deacylated tRNAs, assayed by TLC and autoradiography. (L–N) Toeprinting analysis of the activity of GTPBP1 and eEF1H in one-cycle elongation on MF-STOP (L,M) and MLLSSF-STOP (N) mRNAs with native yeast aminoacylated and deacylated tRNAPhe, as indicated. The positions of 80S ICs and pretranslocated and translocated ECs are indicated at the right. Lanes C, T, A, and G depict the corresponding DNA sequences. (O) The influence of increasing amounts of GTPBP1 on in vitro translation of uncapped luciferase mRNA in RRL. Translation products were quantified by autoradiography relative to those synthesized in the absence of GTPBP1 but in the presence of an equivalent volume of buffer (defined as 100%). Equal loading was confirmed by SimplyBlue staining (not shown). (P) The abundance of GTPBP1 and eEF1A in HEK293 cells under normal growth conditions and following 6 h of amino acid starvation, assayed by Western blotting. (Q) Polysome profiles and ribosomal association of GTPBP1 and eEF1A in HEK293 cells under normal growth conditions and following 6 h of amino acid starvation, assayed by Western blotting. (R) Relative amounts of GTPBP1 and eEF1A associated with ribosomes in HEK293 cells under normal growth conditions and following 6 h of amino acid starvation. Polysomal fractions #12 were normalized with respect to eEF1A levels, assayed by Western blotting.

