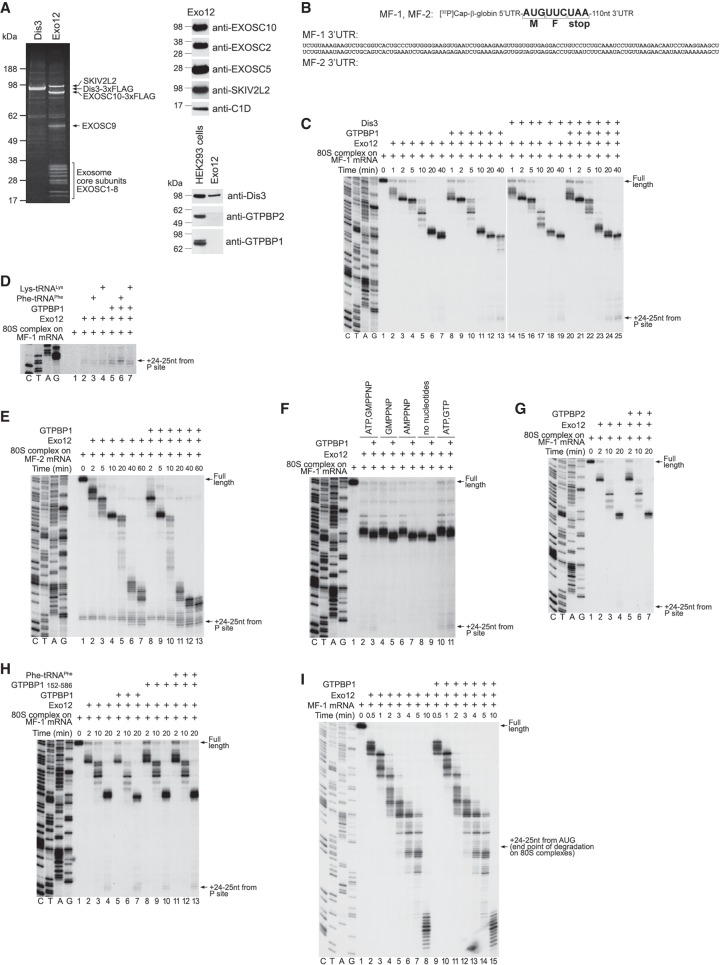
Figure 7.
The influence of GTPBP1 on exosomal degradation of mRNA. (A) Purified DIS3 and Exo12EXOSC10/SKIV2L2/C1D, analyzed by SDS-PAGE followed by fluorescent Sypro staining (left panel) or Western blotting (right panels). (B) Schematic representation of MF-1 and MF-2 mRNAs showing nucleotide sequences of their 3′ UTRs. (C–E,G,H) RNA degradation intermediates obtained after incubation for the indicated time of 80S ICs assembled on [32P]cap-labeled MF-1 (C,D,G,H) or MF-2 (E) mRNAs with Exo12 and various combinations of GTPBP1, DIS3, GTPBP1152–586, GTPBP2, Phe-tRNAPhe, and Lys-tRNALys in the presence of ATP and GTP. (F) RNA degradation intermediates obtained after incubation of 80S ICs assembled on [32P]cap-labeled MF-1 mRNA with Exo12 for 15 min in the presence or absence of GTPBP1 and the indicated nucleotides. (I) RNA degradation intermediates obtained after incubation of free [32P]cap-labeled MF-1 mRNA with Exo12, ATP, and GTP in the presence or absence of GTPBP1 for the indicated time. (C–H) The position of the final cleavage products (+24–25 nt from the P site) is indicated at the right. (C–I) Lanes C, T, A, and G depict the DNA sequences used for RNA size evaluation.

