Figure 1.
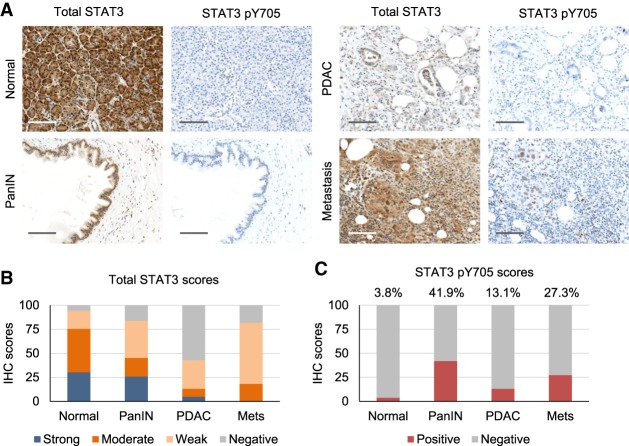
STAT3 expression varies at different stages of pancreatic carcinogenesis. (A) Representative IHC images of STAT3 and STAT3 pY705 staining of human pancreatic TMAs containing normal controls, precancerous lesions (PanIN), primary PDAC tumor samples, and metastatic tumors. Bar, 200 µm. (B) Quantitative analysis of total STAT3 staining for each tissue. (C) Statistical analysis of staining for STAT3 pY705 in the percentage of each sample positive for STAT3.

