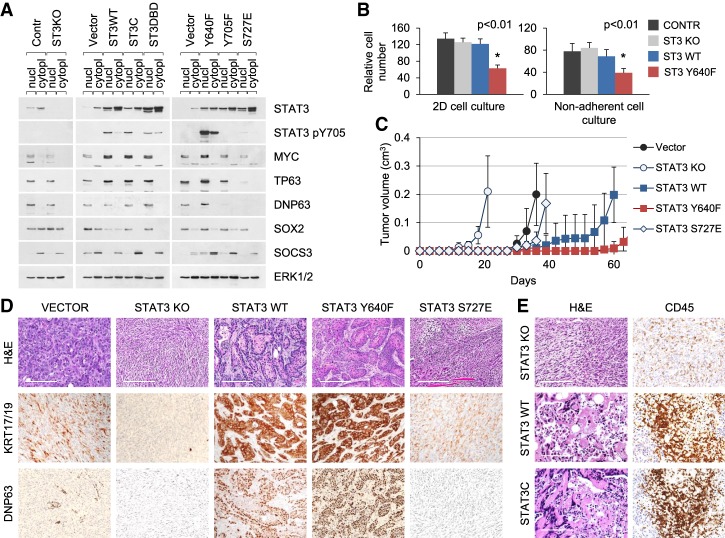
Figure 4.
Loss of STAT3 accelerates KRAS-induced lung cell tumorigenesis. (A) Western blot analysis of nuclear and cytoplasmic extracts from control and STAT3 knockout KRASG12D p53 knockout lung epithelial cells (left panel) and cells transduced with wild-type or mutant STAT3 alleles (middle and right panels). (B) Growth and viability of KRASG12D p53 knockout lung epithelial cells in 2D monolayer (left panel) and 3D nonadherent (right panel) cultures. Relative cumulative cell numbers are shown in cultures for 1 wk. Values correspond to average and SD. Asterisks indicate a statistically significant difference compared with wild-type controls. (C) Subcutaneous tumor formation in nude mice by KRASG12D p53 knockout lung epithelial cells and mutant STAT3 derivatives (104 cells per injection site). n ≥ 4 for each cell type. (D,E) H&E and IHC (KRT17/19, ΔNP63, and CD45) staining of tumors arising from KRASG12D p53 knockout lung epithelial cells shown in C. Representative images are shown. Bar, 200 µm.

