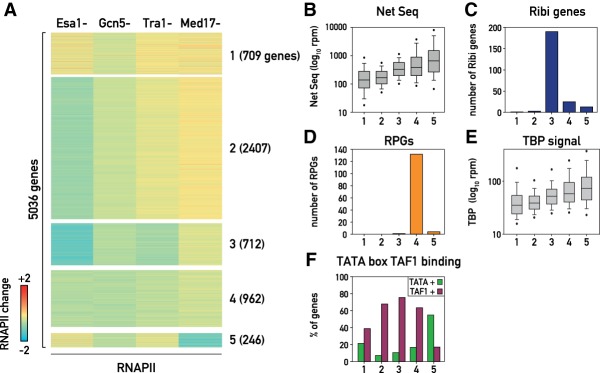
Figure 5.
(A) Heat map representing the result of a k-means clustering analysis on the change in RNAPII occupancy measured in Esa1, Gcn5, Tra1, and Med17 nuclear-depleted cells. (B) Box plots showing the transcription rate measured by nascent elongating transcript sequencing (NET-seq) (Churchman and Weissman 2011) for the genes in the five clusters described in A. (C,D) Bar plots showing the number of Ribi genes (C) and RPGs (D) in each of the five clusters. (E) Box plot showing TBP promoter occupancy for the genes in the five clusters (Kubik et al. 2018). (F) Bar plots showing the percentage of genes having a well-defined TATA box in their promoter (green) and significant TAF1 binding measured by ChIP (purple) as reported in Rhee and Pugh (2012) for each of the five clusters.

