
Figure 3.
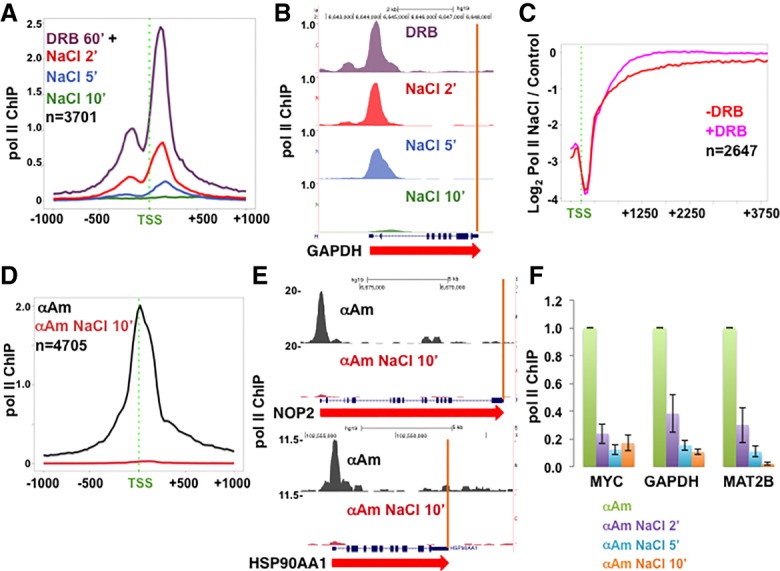
Inhibitors of elongation do not prevent turnover of promoter-proximal Pol II. (A) Turnover of DRB-arrested Pol II at 5′ ends of genes. HCT116 cells were treated with 100 µM DRB for 1 h, and then 350 mM NaCl (final monovalent cations) was added, and Pol II occupancy was assayed by ChIP-seq after 2, 5, and 10 min. Metaplots with 25-base-pair (bp) bins of mean Pol II ChIP-seq normalized to mouse M12 spike-in are shown. (B) UCSC genome browser shot of Pol II ChIP-seq signals on GAPDH as in A. Note the Pol II pileup at the 5′ end and clearance from the gene body in DRB (see also Supplemental Fig. S2B–E). (C) Ratio of Pol II occupancy in HCT116 with or without high NaCl. Pol II ChIP-signals were normalized to yeast spike-ins, and ratios with or without 350 mM NaCl for 10 min at each gene were determined for 100-bp bins. −DRB results are those in Figure 1I, and +DRB (100 µM for 60 min) results are those in Supplemental Figure S2B,C. The genes analyzed are the top one-third ranked for pausing index under control conditions. Note that loss of Pol II in high NaCl at 5′ ends is not compensated for by increased levels at downstream positions. (D,E) Turnover of α-amanitin-arrested Pol II at 5′ ends of genes. HCT116 cells were treated with 5 µg/mL α-amanitin (α-Am) for 24 h (see Supplemental Fig. S2F), and then NaCl was added for 10 min, and Pol II occupancy was assayed by ChIP-seq normalized to a mouse M12 spike-in. (D) Metaplots of mean Pol II ChIP signals. (E) Genome browser shots as in D (see also Supplemental Fig. S2G,H). (F) Rapid turnover of α-amanitin-arrested Pol II. HCT116 cells were treated with 5 µg/mL α-amanitin for 24 h, and then NaCl was added for 2, 5, or 10 min. Mouse M12 cells were spiked in, and Pol II occupancy was assayed at the 5′ ends with normalization to the mouse actin by ChIP-qPCR. Values were normalized to controls without NaCl addition. The mean and SEM for three technical replicates are shown.