Figure 5.

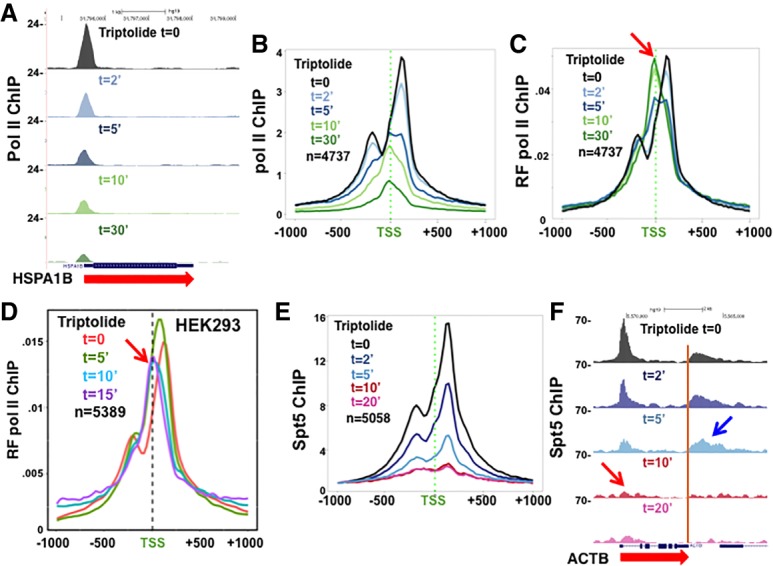
Rapid turnover of paused Pol II complexes under isotonic conditions. (A) Pol II ChIP-seq at HSPA1B at intervals after adding 10 µM triptolide to HCT116 cells normalized to mouse M12 spike-ins (see also Supplemental Figure S4A–C). (B) Metaplots of mean Pol II ChIP signals with 25-bp bins as in A. (C,D) Metaplots of relative frequency (RF) of Pol II ChIP signals in HCT116 and HEK293 cells at time points after adding 10 µM triptolide. Note that within 5 min, the Pol II distribution shifts away from pause sites and becomes centered over the TSS. (E,F) Spt5 ChIP-seq at time points after adding triptolide to HCT116 cells normalized to M12 spike-ins. (E) Metaplots of mean Spt5 ChIP signals with 25-bp bins normalized to bin 1. Note the bimodal distribution of Spt5 at pause sites, in contrast to Pol II. (F) Spt5 ChIP-seq on ACTB as in E. Note the rapid loss of Spt5 from 5′ ends (red arrow) relative to 3′ ends (blue arrow) (see also Supplemental Figure S4D–F).
