Figure 4.

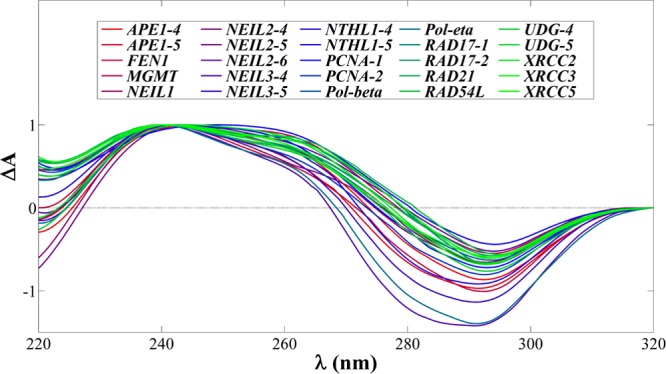
Compilation of the normalized IDS for each oligodeoxynucleotide studied. All spectra are qualitative only and indicative of cytosine protonation. Maxima and minima are tabulated in Table S1.

Compilation of the normalized IDS for each oligodeoxynucleotide studied. All spectra are qualitative only and indicative of cytosine protonation. Maxima and minima are tabulated in Table S1.