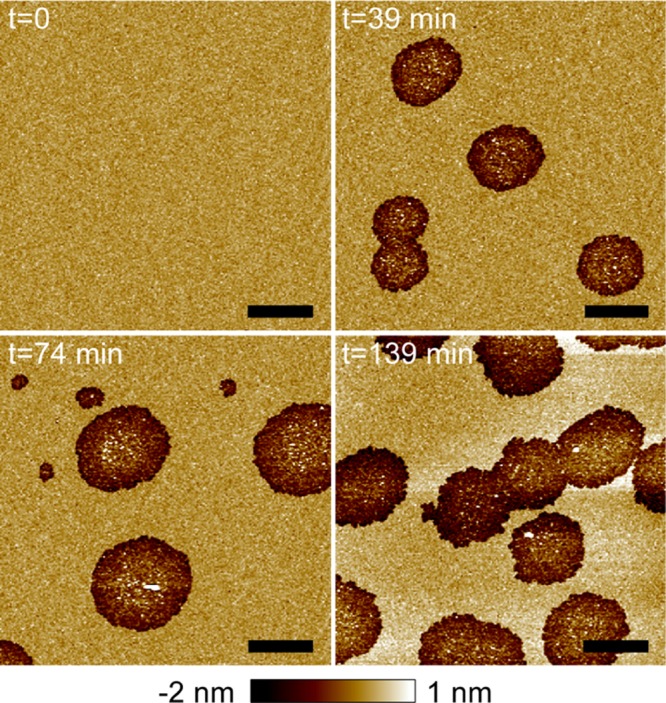
Figure 1.

AFM images of a POPC/POPG 4:1 bilayer exposed to 1 μM αSyn as a function of the incubation time. Scale bars are 2 μm. Image height scale is indicated by the color bar at the bottom. The same color bar (with modified height scale if noted) is applied throughout the paper for AFM images. The area fractions of αSyn-induced semi-transmembrane defects are 0.14, 0.20, and 0.41 as the incubation time increases from 39 to 139 min.
