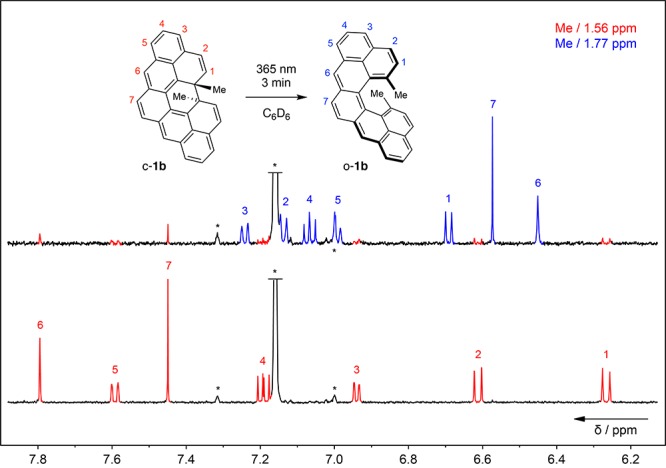
Figure 1.

1H NMR spectra (600 MHz, C6D6, 25 °C) of c-1b (red) recorded before (bottom) and after (top) irradiation at 365 nm for 3 min, which generates o-1b (blue). The assignment of the proton resonances is shown (for 2D spectra, see the Supporting Information). Black asterisks denote the residual solvent and its satellite signals.
