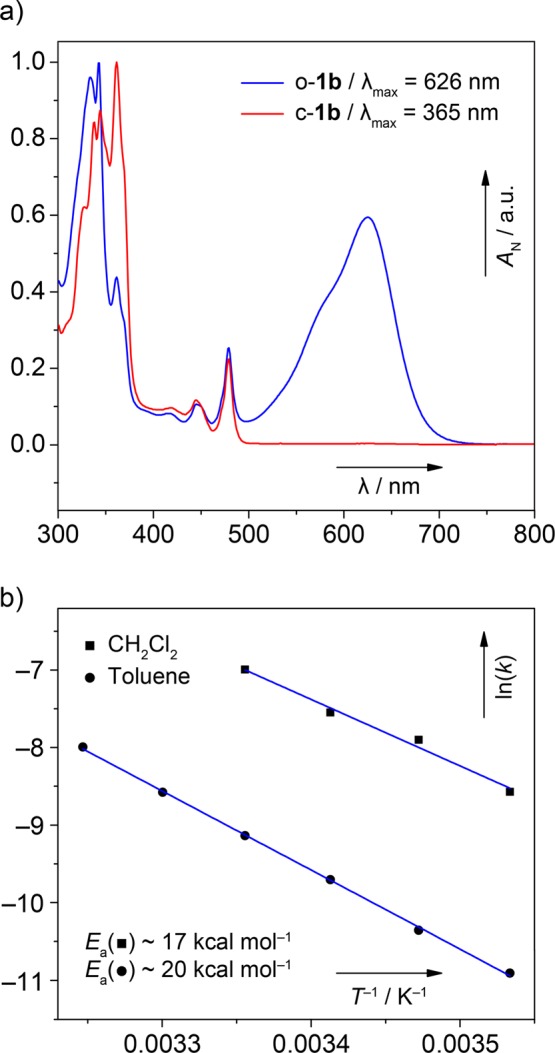
Figure 3.

(a) Normalized UV–vis spectra of a solution of c-1b in toluene (∼10–4 M, 298 K) before (red trace) and after (blue trace) irradiation (365 nm, 1 min), which generates o-1b. The absorption bands with low intensity at 450 and 480 nm belong to an unknown impurity. (b) Arrhenius plots of ln k against 1/T used for determination of Ea in CH2Cl2 and toluene.
