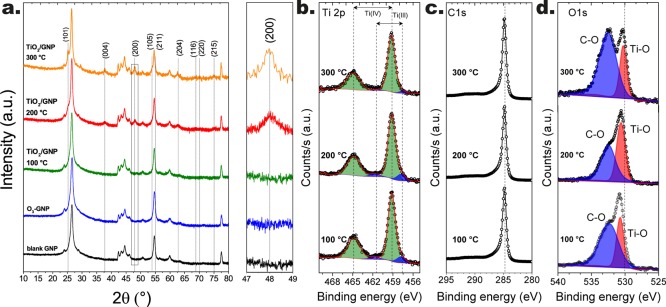
Figure 2.
XRD spectra (a) and XPS spectra (b–d) of the TiO2 graphene composites obtained after 10 cycles at different temperatures. In particular, (b) shows the XPS spectra of the Ti 2p region, (c) shows the spectra of the C 1s region, and (d) shows the spectra of the O 1s regions. All the experiments were carried out by following the pulsing sequence: 30 s TiCl4-5 min N2 purge-30 s H2O-5 min N2 purge.

