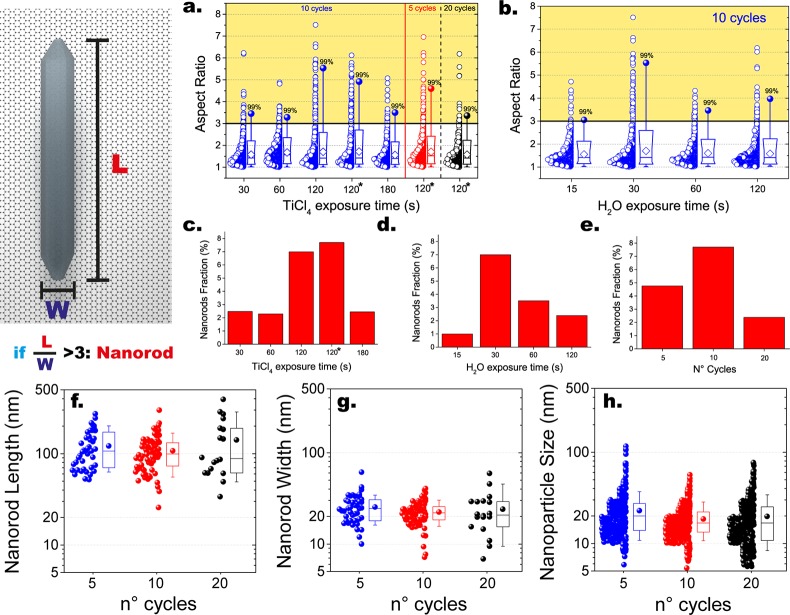
Figure 5.
Summary of the statistical analysis of the shape of the nanostructures obtained with ALD at 300 °C. Box plots and data overlap of the evolution of the AR as a function of the TiCl4 and H2O exposure time (a,b). The boxes indicate the 10th, 25th, 75th, and 90th percentiles of the population, the full circle indicates the maximum, the white diamonds indicate the average, and the horizontal line indicates the median. Evolution of the average fraction of NRs, that is, the number of NRs divided by the total number of observed nanostructures, as a function of TiCl4 (c) and H2O (d) exposure time, and of the number of cycles (e). The asterisks indicate that the experiments were carried out with the TiCl4 bubbler kept at 30 °C, otherwise all the data were obtained with experiments in which the TiCl4 and H2O bubbler were kept at 0 and 30 °C respectively. Box plots and data overlap of the evolution of the (f) length and (g) width of the NRs and of the (h) size of the NPs with the number of cycles (pulse sequence: 2–5 min-30 s-5 min). The boxes indicate the 10th, 25th, 75th, and 90th percentiles of the population, the full circle indicates the average, and the horizontal line indicates the median.

