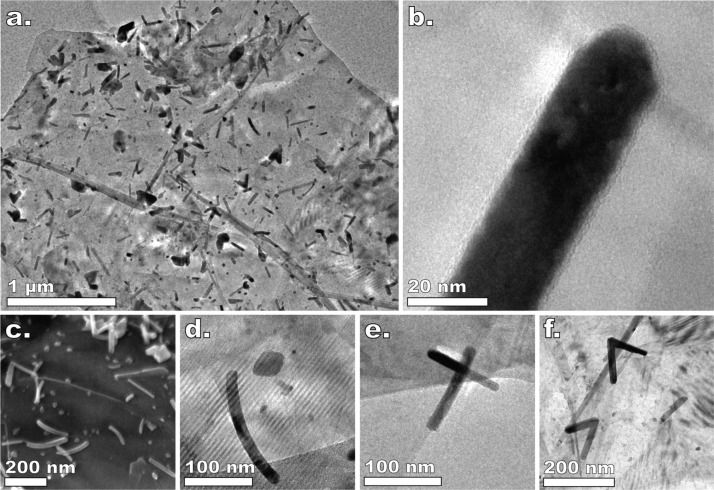
Figure 6.
(a) TEM micrograph of a graphene nanoplatelet after 10 ALD cycles carried out at 300 °C using the pulsing sequence: 2 min TiCl4—5 min N2—30 s H2O—5 min N2. (b) TEM micrograph of the tip of a NR encapsulated by an amorphous layer. Field emission SEM micrograph of the TiO2/graphene composites obtained after 10 cycles at 300 °C (c) using the same pulsing sequence as in (a). Selection of TEM micrographs of NRs of peculiar morphology: curved NR (d), NR aligned with the edge of the nanoplatelet (e), and v-shaped NRs (f).

