. 2018 Aug 17;7:e36246. doi: 10.7554/eLife.36246

Figure 1. Climbing fiber-evoked Ca2+ signals in PCs during behavior.

(A) Head-fixed mice were trained to lick water from a port, cued by an audible tone, using the procedure shown. (B) Across-trial distribution of lick probability, aligned to the delivery of water, for a trained mouse. (C) Continuous record of Ca2+ activity in a PC dendrite. Expanded area shows algorithmically identified climbing fiber-evoked events (blue tick marks). Isolated Ca2+ events, indicated by the checkmark, were collected for analysis. (D) Average of climbing fiber-evoked Ca2+ events in PC dendrites occurring during water consumption (blue) or in the absence of licking (black). Measurements were obtained from 11 to 51 PCs in each of 11 mice; 211 cells total. (E) Genetic targeting of PCs and MLI using AAVs with GCaMP6f under control of the Pcp2 promoter and Cre-dependent RCaMP2 in Kit::Cre mice. In vivo images are from an infected area of Crus II. (F) The average frequency of climbing fiber-evoked Ca2+ events in PC dendrites (11 to 19 PCs in each of 5 mice; 82 cells total) plotted against the response in MLIs, acquired simultaneously in a subset of recordings (3 mice). (G) Trial-averaged measurement of MLI activity during cued licking. The peak amplitudes of Ca2+ events in PCs, plotted below, that correspond to three different phases of MLI activation during the task (4 to 19 PCs in each of 6 mice; 79 cells total; p=0.99, ANOVA test).

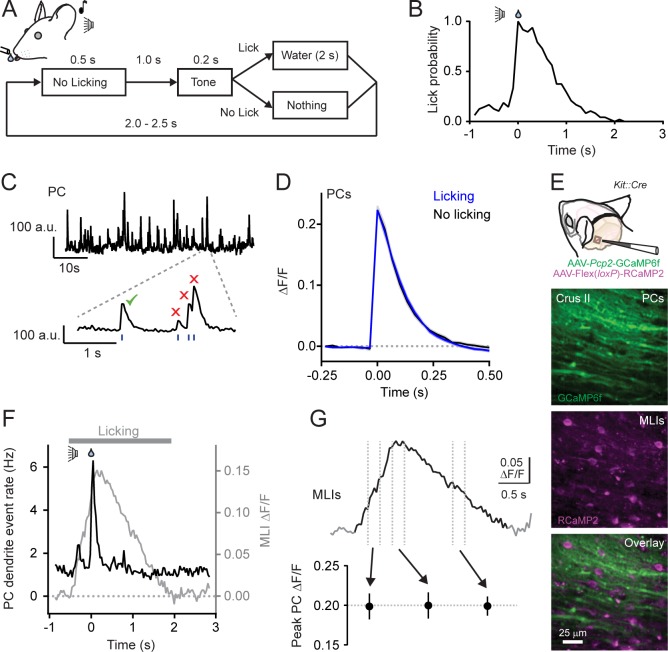
Figure 1—source data 1. Source data for panels D and G.
DOI: 10.7554/eLife.36246.008

Figure 1.

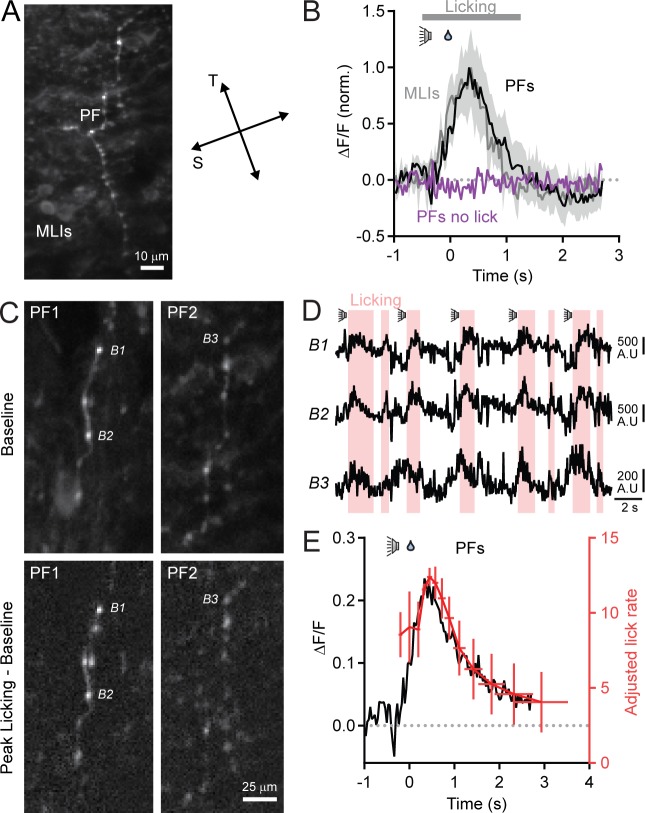
Figure 1—figure supplement 1. Ca2+ activity measurements in parallel fibers.

Figure 1—figure supplement 1.

(A) 2pLSM image from Crus II of an awake mouse previously injected with AAV containing GCaMP6f under control of the synapsin promoter. GCaMP6f expression is apparent in both parallel fibers (PFs) and MLIs. Parallel fibers were identifiable because branches ran unbifurcated over distance (>10 μm) in a transverse (T) direction whereas MLI processes projected stochastically with branches predominately in a sagittal orientation (S). (B) Normalized Ca2+ activity measurements from parallel fibers (black) and MLIs (gray) recorded simultaneously during cued licking. Error bars represent SEM (3 to 5 PFs and 5 to 15 MLIs in each of 2 mice). No discernable change in activity was apparent in PFs when the animal did not lick in response to the sound cue (purple). Similar results were obtained for MLIs, but were excluded for clarity. (C) Top row: baseline fluorescence images for two separate parallel fibers (PFs) in the molecular layer. Bottom row: difference images calculated by subtracting resting fluorescence from the evoked response during the peak phase of cued licking. Images are the averages of many trials. Three boutons are labeled. (D) Raw fluorescence traces for the three identified boutons. The highlighted regions indicate bouts of licking. (E) Comparison of average parallel fiber activity (black trace) and adjusted lick rate (red trace). Error bars represent SEM. Data were obtained from 1 to 5 fibers from each of 3 mice; nine total fibers.
Figure 1—figure supplement 1—source data 1. Source data for panels B and E.
DOI: 10.7554/eLife.36246.004
Figure 1—figure supplement 2. Analysis of non-isolated PC dendritic Ca2+ events.

Figure 1—figure supplement 2.

(A) Comparison of the fraction of responses composed of single isolated events or those containing overlapping events, grouped closely in time. Responses were categorized whether they occurred during water consumption (blue) or in the absence of licking (black). Data from individual animals are shown in gray. Significant differences were not found between the two behavioral states (p=0.26 for isolated events, or 0.57, and 0.18, for two or three overlapping Ca2+ events, respectively; paired Student’s t-test). (B) Averages of responses containing two dendritic Ca2+ events, separated by 150–200 ms. Neither peak was significantly different between the two conditions (p=0.91 and 0.28, respectively; paired Student’s t-test). (C) Cumulative probability of amplitudes for all Ca2+ events occurring during water consumption (blue, 18,320 events) and those in the absence of licking (black, 5,839 events). Means were not significantly different (p=0.57, paired Student’s t-test). All measurements taken from 11 to 19 PCs in each of 7 mice; 100 cells total.
Figure 1—figure supplement 2—source data 1. Source data for panels A-C.
DOI: 10.7554/eLife.36246.006
Figure 1—figure supplement 3. PC Ca2+ event amplitudes do not co-vary with the level of MLI activity.

Figure 1—figure supplement 3.

Examples from three mice plotting the amplitudes of all identified PC Ca2+ events (each point is an individual dendritic Ca2+ event) and the corresponding Ca2+ activity measurement in surrounding MLIs acquired at the same time. The data were fit with linear regressions.