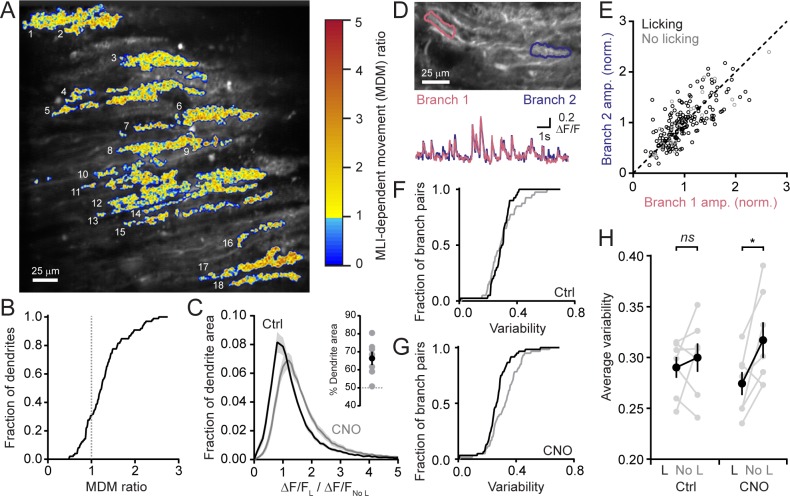
Figure 3. MLIs broadly influence climbing fiber-evoked Ca2+ signaling in PCs.
(A) The across-session change in trial-averaged PC Ca2+ activity, colored-coded based on the extent to which chemogenetic disinhibition affected responses during movement (MDM ratio; see Materials and methods). Each algorithmically identified PC dendrite is numbered. (B) Cumulative probability histograms of the effect of disinhibition on trial averaged Ca2+ activity in identified PCs (2 to 15 PCs each from seven mice, 50 cells total). Dotted line demarcates a threshold level of change indicative of enhancement with disinhibition (MDM ratio >1). (C) Histogram of average Ca2+ activity measurements, determined for each dendritic pixel across the PC population, during licking (L) divided by that observed in the absence of licking (No L), in both control sessions (black) as well as after administration of CNO (gray). For all mice (N = 7), the distributions were significantly different (p<0.0001, Kolmogorov-Smirnov test). The inset shows the summary of ROC analysis on these distributions, obtained for each mouse, where area under the curve was used to calculate the percentage of pixels that showed an effect with chemogenetic disinhibition (gray, individual mice; black, the mean ± SEM). (D) In the image, two segments of a dendrite from distinct branches of the same PC are outlined. Measurements of Ca2+ activity in these segments are shown superimposed in the traces below. (E) Comparison of the amplitudes of simultaneous, inter-branch Ca2+ events for many climbing fiber-evoked responses for the two branches shown in example in panel D. Events were sorted based on whether they occurred during water consumption (black) or in the absence of licking (gray). Unity is marked by the dashed line. (F,G) Cumulative probability of the inter-branch variance of climbing fiber Ca2+ event amplitudes (see Materials and methods). Events were sorted depending on their correspondence with water consumption (black) or the absence of licking (gray). Distributions were not different in control sessions (N = 74 pairs; range: 4 to 20 pairs each from seven mice; p=0.57, Kolmogorov-Smirnov test) but were in the disinhibited condition with CNO (N = 114 pairs; range 12 to 28 pairs each from seven mice; p=0.0013, Kolmogorov-Smirnov test). (H) The effect of molecular layer disinhibition on average inter-branch variability of Ca2+ event amplitudes in PCs. In control sessions, the variance was similar whether or not events occurred during licking movements (p=0.50; paired Student’s t-test). In contrast, a modest, but significant drop in variability occurred during movement with disinhibition (p=0.029; paired Student’s t-test). Black, group average (mean ± SEM); gray, individual mice.

