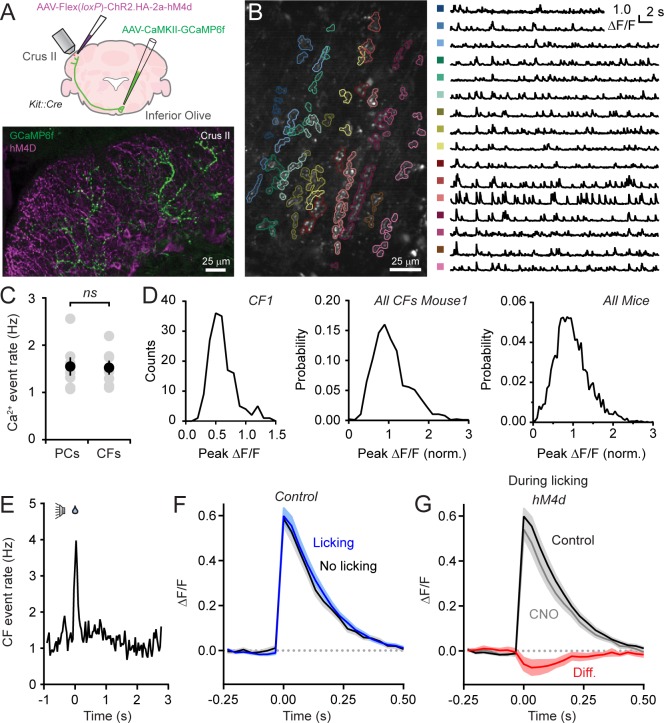
Figure 4. Disinhibition does not affect presynaptic climbing fiber activity.
(A) AAVs containing genetically encoded activity reporters and effectors were injected in the inferior olive and lobule Crus II of Kit::Cre mice, respectively. Image from fixed tissue showing GCaMP6f expression in climbing fibers and HA-tagged hM4d in MLIs. (B) In the image, individual climbing fibers were identified using automated segmentation routines. Traces show activity measurements from color-coded climbing fibers. (C) Ca2+ event rates in PC dendrites and climbing fibers, measured in separate cohorts of mice (11 to 19 PCs and 2 to 6 climbing fibers each from 7 mice, 100 and 29 total, respectively). Black circles, mean ± SEM; gray circles, measurements from individual mice (p=0.92, Student’s t-test). (D) Distribution of Ca2+ event amplitudes for an individual climbing fiber, all climbing fibers in a single mouse (N = 6), and for all mice (2 to 12 climbing fibers each from 7 mice, 36 fibers total). Data were normalized to facilitate comparisons across climbing fibers. (E) The frequency of Ca2+ events in climbing fibers during cued licking (average of 3 mice). (F) Average of isolated Ca2+ events in climbing fibers collected either during the consumption of water (blue) or in the absence of licking (black). Measurements obtained from 4 to 12 climbing fibers each from 5 mice, 38 fibers total. (G) Ca2+ events recorded in climbing fibers both in control and during sessions with chemogenetic MLI activity suppression. Events were collected only during periods of water consumption (4 to 9 climbing fibers each from 5 mice, 26 fibers total). The difference signal is shown in red.

